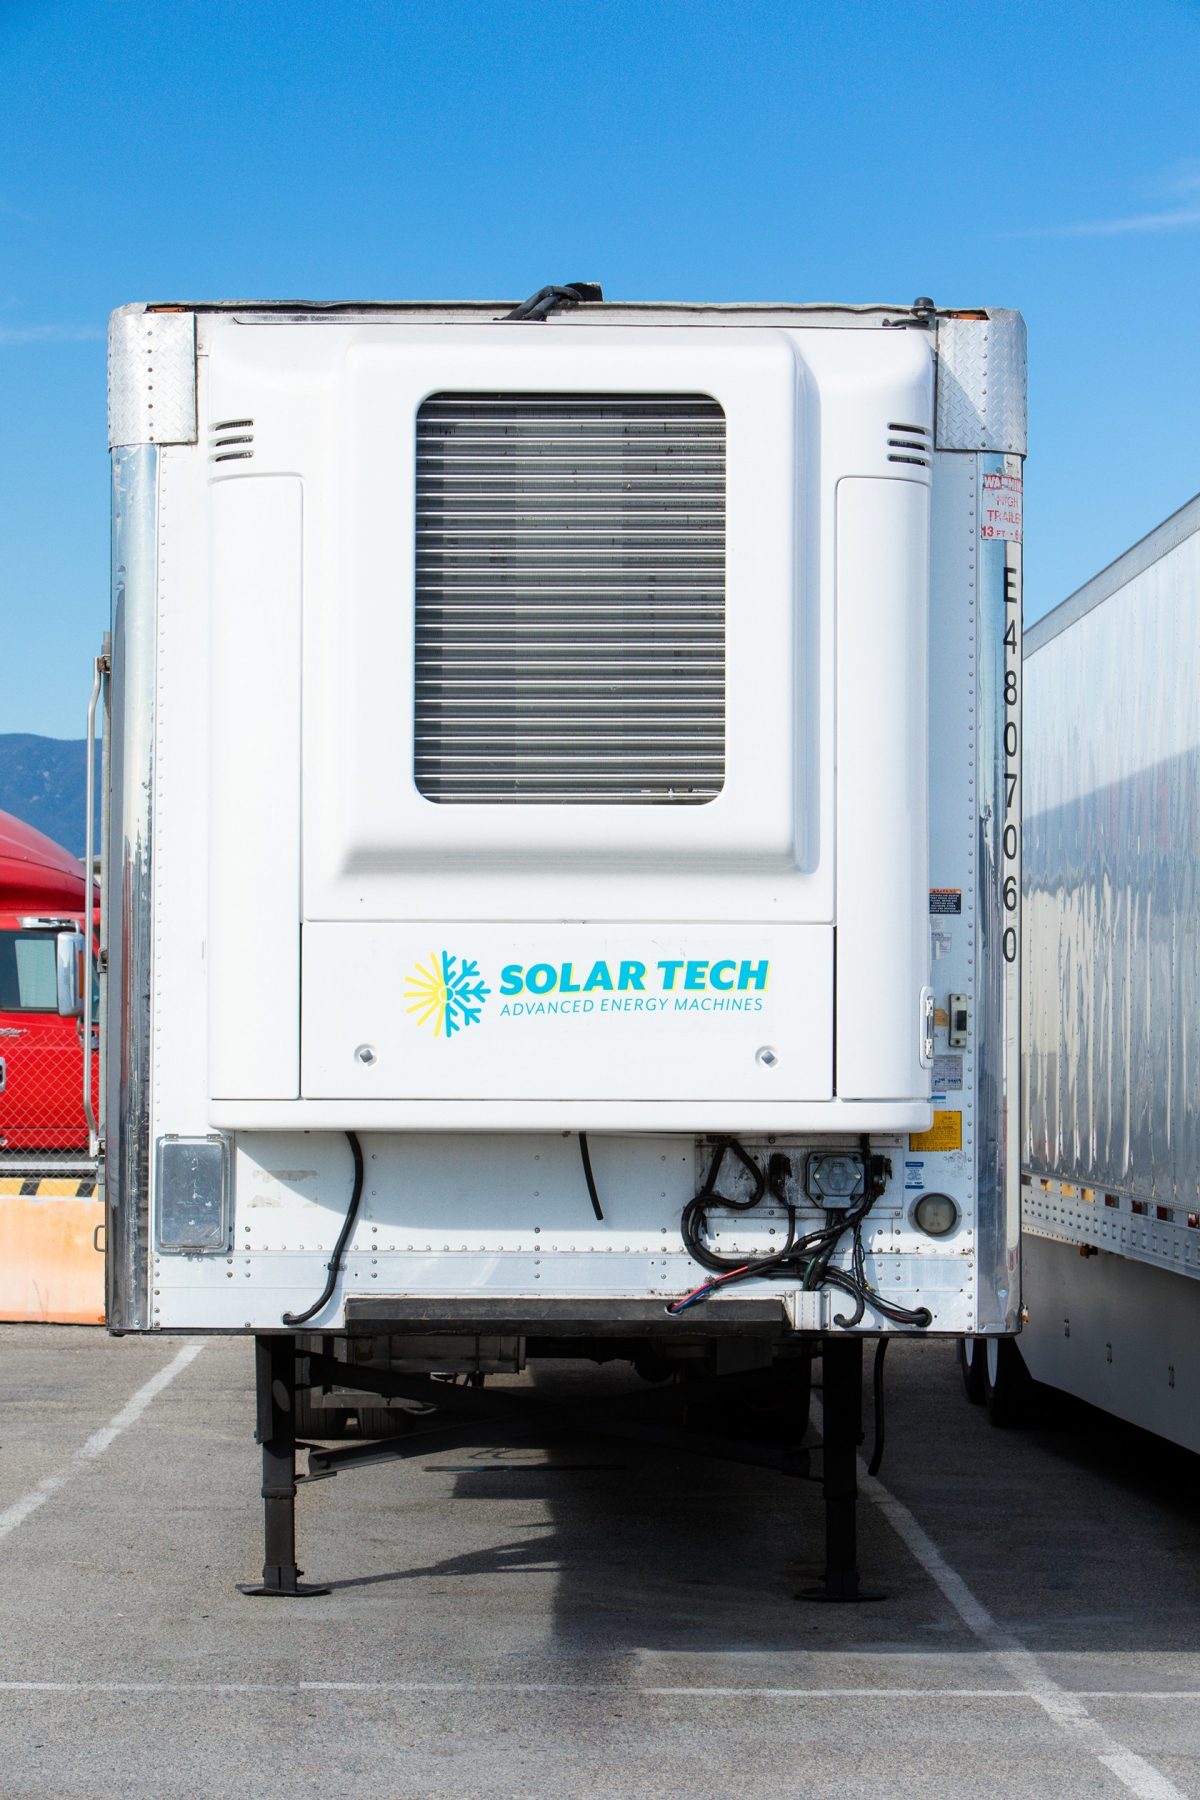
SAN FRANCISCO, Jan. 5, 2021 /PRNewswire/ — PLM Fleet LLC dba PLM Trailer Leasing («PLM») now offers a net-zero emission refrigerated trailer as an alternative energy fleet solution. Through a partnership with Advanced Energy Machines, («AEM»), the zero emission AEM Solar Tech Transportation Refrigeration Unit («TRU») is a complete all electric solution with an industry standard operating range. The Solar Tech electric TRU offers best in class design and operation, including:

- Single and multi-temperature options
- Full-range temperature control and performance
- 30+ hours of continuous use between charges
- Fully charged in 8 hours
- Weight-neutral compared to traditional diesel TRU
- Safe, 40-volt DC non-arc charging
PLM is the exclusive sales and marketing company for the AEM electric TRU and a California Clean Air Off-Road Equipment («CORE») program approved dealer offering on-site consulting for facility and refrigerated trailers leveraging alternative energy and developing programs to transition your business to clean energy.
PLM’s Vice President of Sales Mike Marshall adds «Through the PLM – AEM partnership customers can be assured that they are getting the best technology offered today; the latest in zero emissions refrigeration technology on the road with leasing, distributed energy site solutions, and complete services support.» Test and trial trailers in a selection of trailer lengths and designs are available today.
- Personalized training and support structure
- Remote temperature and operations management with ColdLink®
- Complete site evaluation for infrastructure
- Reservations available, ask about pricing and recommended trial periods
*currently available in California
About PLM
PLM, headquartered in Newark, New Jersey, is an industry leader and the only company with nationwide locations dedicated exclusively to the leasing, rental, maintenance, IoT solutions and fleet management of refrigerated trailers in the Cold Supply Chain. For more information, please visit www.plmtrailer.com or call 1- 877-736-8756
About AEM
From semiconductors to semi-trailers, AEM founders Ronald and Robert Koelsch have been engineering innovative products and building specialized business relationships for over thirty years. AEM combines years of education and experience in engineering, science, industry, sales, marketing, and business management with patented technology to provide customers with products that are reliable, cost-effective, and commercially viable. For more information, visit http://www.aem.green
Media Contact
Nicole Greco
PLM
+1 862-229-6480
ngreco@plmfleet.com

![]() View original content to download multimedia:http://www.prnewswire.com/news-releases/plm-paves-the-way-with-zero-emissions-for-the-transport-refrigerated-unit-301201487.html
View original content to download multimedia:http://www.prnewswire.com/news-releases/plm-paves-the-way-with-zero-emissions-for-the-transport-refrigerated-unit-301201487.html
SOURCE PLM


")