¡HOLA! TV se incorpora a la programación Latina de Spectrum y se consolida en EE.UU.

MIAMI, 2 de julio de 2020 /PRNewswire-HISPANIC PR WIRE/ — ¡HOLA! TV acaba de reforzar su presencia en EE.UU. tras cerrar un acuerdo con Charter Communications por el que se integra a la programación Latina de Spectrum y, en concreto, a los paquetes ‘Mi Plan Latino’ y ‘Latino View’. 

<img id="prnejpg2390left" title="HOLA TV – LOGO" border="0" alt="HOLA TV – LOGO" align="middle"…

MIAMI, 2 de julio de 2020 /PRNewswire-HISPANIC PR WIRE/ — ¡HOLA! TV acaba de reforzar su presencia en EE.UU. tras cerrar un acuerdo con Charter Communications por el que se integra a la programación Latina de Spectrum y, en concreto, a los paquetes ‘Mi Plan Latino’ y ‘Latino View’. 

HOLA TV - LOGO

¡HOLA! TV continúa así su expansión por el mercado hispano de EEUU, donde ya tiene presencia en los principales operadores con una oferta original y de calidad que le ha convertido en referencia, especialmente en temas relacionados con las casas reales de todo el mundo, la moda, las celebridades del momento y estilo de vida.

Marcos Pérez, CEO & General Manager de ¡HOLA! TV: «Este nuevo lanzamiento en EEUU, nos permite afianzar el canal en un mercado muy competitivo que pone aún más en valor este acuerdo con Charter Communications».

¡HOLA! TV, con más de 700 horas de producción original, se estrena en Spectrum con grandes novedades como ‘LA HORA ¡HOLA!’ con toda la actualidad del universo de las celebridades, la moda y la realeza; nuevas entregas de ‘Top Estilo’ dedicadas a las alfombras rojas desplegadas en los últimos premios, estrenos y galas, así como la cita semanal de ‘Coronas y Palacios’, un recorrido por el mundo de la realeza con una visión muy cercana, entre otros.

Acerca de

¡HOLA! TV es una empresa conjunta formada por ATRESMEDIA INTERNACIONAL y la Revista ¡HOLA!, la fuente más respetada y exclusiva de noticias de todo el mundo sobre celebridades, miembros de la realeza y de la aristocracia. La programación de ¡HOLA! TV presenta lo mejor de la revista ¡HOLA!, que publica 31 ediciones que llegan a más de 120 países, llevado a la televisión con noticias, exclusivas y programación especial que reflejan el estilo y la filosofía de la marca ¡HOLA! La cobertura del canal incluye acceso exclusivo a historias de gran interés humano, programas dedicados al estilo de vida de las celebridades con un enfoque especial en las noticias sobre los miembros de la realeza en todo el mundo. Las oficinas principales de ¡HOLA! TV se encuentra en Miami, donde también se producen varios programas originales. Otros, se realizan por ¡HOLA! MEDIA y ATRESMEDIA en sus estudios en España.

Contactos para los medios:

¡HOLA! TV

ATRESMEDIA INTERNACIONAL

Ariana Troconiz

Blanca Aguirre

ariana.troconiz@hola.tv

blanca.aguirre@atresmedia.com

Oficina: +1 (305) 777-1900

Oficina: +34 619 860 074

Logo – https://mma.prnewswire.com/media/1199606/HOLA_TV_Logo.jpg


FUENTE Atresmedia Internacional

Diesel Power Engine Market Worth $7.9 Billion by 2025 – Exclusive Report by MarketsandMarkets™

CHICAGO, July 2, 2020 /PRNewswire/ — According to the new market research report «Diesel Power Engine Market by Operation (Standby, Prime, and Peak Shaving), Power Rating (Below 0.5 MW, 0.5-1 MW, 1.0-2 MW, 2.0–5 MW, and Above 5 MW), End User (Industrial, Commercial, and Residential), Speed, and Region – Global Forecast to 2025«, published by…

CHICAGO, July 2, 2020 /PRNewswire/ — According to the new market research report «Diesel Power Engine Market by Operation (Standby, Prime, and Peak Shaving), Power Rating (Below 0.5 MW, 0.5-1 MW, 1.0-2 MW, 2.0–5 MW, and Above 5 MW), End User (Industrial, Commercial, and Residential), Speed, and Region – Global Forecast to 2025«, published by MarketsandMarkets™, the Diesel Power Engine Market is expected to reach USD 7.9 billion by 2025 from an estimated value of USD 6.3 billion in 2020, at a CAGR of 4.6%. In Asia Pacific, increasing electricity demand, and industrialization projects in the countries such as China, Japan, India, and South Korea are the main factors driving the growth of the Diesel Power Engine Market in the region. In North America, and Europe the demand for diesel power engines is in large part driven by the investments in datacenters, and other commercial facilities.

MarketsandMarkets Logo

The Diesel Power Engine Market includes major Tier I and II suppliers like Caterpillar, Cummins, Wartsila, Rolls Royce Holdings, and MAN SE. These suppliers have their manufacturing facilities spread across various countries across Asia Pacific, Europe, North America, Middle East & Africa, and South America. COVID-19 has impacted their businesses as well.

Download PDF Brochure:

https://www.marketsandmarkets.com/pdfdownloadNew.asp?id=65999135

The industrial segment is expected to be the largest Diesel Power Engine Market, by operation, during the forecast period

Industries require standby power generation to be used in the case of power outages or voltage fluctuations. Several large industries are in remote locations where distribution supply is unavailable. In such situations, industries need power generation to provide prime power and require other sets of power generation for emergencies. Temporary power supply for projects is another major application in industrial segment. Increased industrial activity and investments in Asia Pacific are expected to drive the demand for diesel power engines.

Browse in-depth TOC on «Diesel Power Engine Market»

111 – Tables

66 – Figures

189– Pages

View Detailed Table of Content Here:

https://www.marketsandmarkets.com/Market-Reports/diesel-power-engine-market-65999135.html 

The Above 1000 rpm segment is projected to dominate the Diesel Power Engine Market during the forecast period

Demand for diesel power engines from the industrial and commercial sectors for standby power generation and peak shaving is the major driver for demand in this segment. High-speed diesel engines which operate at speeds of more than 1000 rpm are popular in low- and medium-power engine segments. These high-speed engines offer advantages such as low initial cost, better fuel efficiencies, low maintenance cost, and reduced overhaul frequency and related costs. Industrial and commercial end users prefer diesel power engines of this segment due to their quick-start capability.

Speak to Analyst:

https://www.marketsandmarkets.com/speaktoanalystNew.asp?id=65999135 

Europe is projected to be the fastest growing Diesel Power Engine Market during the forecast period

In this report, the Diesel Power Engine Market has been analyzed across five regions, namely, Asia Pacific, North America, Europe, Middle East & Africa, South America. High growth in European market is driven by the increased investments in datacenters owing to the demand from global trends, digitalization, analytics, and cloud computing. Key policy decisions by the EU, especially General Data Protection Regulation (GDPR), which indirectly forces global companies to process European data on European soil, are expected to drive the demand in this area. Emergency standby power is required for datacenters to stay online in spite of the main power grid supply interruptions. These factors are expected to drive the growth of diesel power engines in Europe.

To enable an in-depth understanding of the competitive landscape, the report includes the profiles of some of the top players in the Diesel Power Engine Market. The key players include Caterpillar (US), Cummins (US), Wartsila (Finland), Rolls Royce Holdings (UK), MAN SE (Germany), Mitsubishi Heavy Industries Engine & Turbocharger (Japan), and Volvo Penta (Sweden).

Browse Adjacent Markets: Energy and Power Market Research Reports & Consulting

Browse Related Reports:

Gas Engines Market by Fuel Type (Natural Gas, Special Gas) Application (Power Generation, Cogeneration, Mechanical Drive) End-User (Utilities, Manufacturing, Oil & Gas) Power Output (0.5–1MW, 1–2MW, 2–5MW, 5–10 MW, 10–20MW), Region – Global Forecast to 2024

https://www.marketsandmarkets.com/Market-Reports/gas-engine-market-54641802.html 

Generator Sales Market by Type (Diesel, Gas), Application (Standby, Peak Shaving, Continuous), Power Rating (<100 KVA, 100-350 KVA, 350-1000-2500 KVA, 2500-5000 KVA, >5000 KVA), End-User (Residential, Commercial, Industrial)- Global Forecast to 2024

https://www.marketsandmarkets.com/Market-Reports/generator-sales-market-47544335.html 

About MarketsandMarkets™ 

MarketsandMarkets™ provides quantified B2B research on 30,000 high growth niche opportunities/threats which will impact 70% to 80% of worldwide companies’ revenues. Currently servicing 7500 customers worldwide including 80% of global Fortune 1000 companies as clients. Almost 75,000 top officers across eight industries worldwide approach MarketsandMarkets™ for their painpoints around revenues decisions.

Our 850 fulltime analyst and SMEs at MarketsandMarkets™ are tracking global high growth markets following the «Growth Engagement Model – GEM». The GEM aims at proactive collaboration with the clients to identify new opportunities, identify most important customers, write «Attack, avoid and defend» strategies, identify sources of incremental revenues for both the company and its competitors. MarketsandMarkets™ now coming up with 1,500 MicroQuadrants (Positioning top players across leaders, emerging companies, innovators, strategic players) annually in high growth emerging segments. MarketsandMarkets™ is determined to benefit more than 10,000 companies this year for their revenue planning and help them take their innovations/disruptions early to the market by providing them research ahead of the curve.

MarketsandMarkets’s flagship competitive intelligence and market research platform, «Knowledge Store» connects over 200,000 markets and entire value chains for deeper understanding of the unmet insights along with market sizing and forecasts of niche markets.

Contact:
Mr. Aashish Mehra
MarketsandMarkets™ INC.
630 Dundee Road
Suite 430
Northbrook, IL 60062
USA: +1-888-600-6441
Email: sales@marketsandmarkets.com 
Research Insight: https://www.marketsandmarkets.com/ResearchInsight/diesel-power-engine-market.asp 
Visit Our Web Site: https://www.marketsandmarkets.com 
Content Source: https://www.marketsandmarkets.com/PressReleases/diesel-power-engine.asp

Logo: https://mma.prnewswire.com/media/660509/MarketsandMarkets_Logo.jpg

Automotive Power Electronics Market Worth $4.7 Billion by 2025 – Exclusive Report by MarketsandMarkets™

CHICAGO, July 2, 2020 /PRNewswire/ — According to the new market research report «Automotive Power Electronics Market by Device Type (Power IC, Module & Discrete), Application, Component (Sensor & Microcontroller), Material, Vehicle Type (Passenger Vehicle, LCV…

CHICAGO, July 2, 2020 /PRNewswire/ — According to the new market research report «Automotive Power Electronics Market by Device Type (Power IC, Module & Discrete), Application, Component (Sensor & Microcontroller), Material, Vehicle Type (Passenger Vehicle, LCV & HCV), Electric Vehicle Type, and Region – Global Forecast to 2025″, published by MarketsandMarkets™, the global Automotive Power Electronics Market size is projected to grow from USD 3.8 billion in 2020 to USD 4.7 billion by 2025, at a CAGR of 4.7%.

MarketsandMarkets_Logo

Browse in-depth TOC on «Automotive Power Electronics Market»
314 – Tables
64 – Figures
271 – Pages

Download PDF Brochure:
https://www.marketsandmarkets.com/pdfdownloadNew.asp?id= 226516353  

The increasing electronics content inside the vehicle for the operation of specific vehicle applications and government mandates related to carbon emissions and vehicle safety are some of the key factors that will drive the market for Automotive Power Electronics Market. Developments in the power converters of the electric vehicle is also one of the factor that drives the Automotive Power Electronics Market.

Vehicle production was low in April and May 2020 in the major European, Asia Pacific countries and the US due to the ongoing COVID-19 pandemic. Earlier, the Automotive Power Electronics Market was expected to witness rapid growth from 2022 onward as major safety regulations are outlined to be imposed. As vehicle production is suspended, any new investment for advanced technology is unlikely. OEMs and tier 1 players are either using cash reserves or acquiring funds to continue operations during the crisis. OEMs are still skeptical about the recovery of vehicle sales to 2019 levels in 2020.

Increasing use of mechatronics devices and comfort features inside the vehicle is expected to result in the dominance of body control & comfort segment in Automotive Power Electronics Market

Body control & comfort comprise of features like tire pressure monitoring system (TPMS), lighting, seat control, heating, ventilation and air conditioning (HVAC) and start-stop module. Vehicles across the globe are getting installed with latest versions of these sub-applications of body control & comfort. Start-stop module sub-application is showing tremendous growth in recent years. On the other hand vehicles are getting installed with modern LED technologies for both interior and exterior lighting. TPMS is treated as a good to have feature in the vehicle. Luxury vehicles are getting fitted with advanced seat controls and heated/ventilated seats. These applications are becoming essential features in passenger vehicles. Also features like LED lightings, TPMS and star-stop modules are getting installed in other category of vehicles like light commercial and heavy commercial vehicles. These are main factors that is fueling the market for body control & comfort segment by application type of Automotive Power Electronics Market.

Increasing use of modern materials like SiC and GaN for power modules and discrete is helping power module/discrete to dominate the market of automotive power electronics by device type

Power semiconductor devices like power IC, module and discrete are considered as main solid-state devices in power electronics. With the increasing electronic content inside the vehicle, traditional mechanically operated systems or applications are getting advanced and efficient. For its proper functioning, power modules and discrete are essential. Number of installation of power module and discrete is more than power IC. Because of operational advantages of Silicon Carbide (SiC) and Gallium Nitride (GaN) over traditionally used transistors, power modules are getting advanced and are suitable for handling critical to operate system. This in turn is helping power module/discrete segment to dominate Automotive Power Electronics Market by device type.

Power IC segment is also showing good individual growth in the Automotive Power Electronics Market by device type. It is a must have device type for the power electronics of a vehicle. Power ICs are costlier than that of power module/discrete. However, prices of these devices types are going down every year.

Request FREE Sample Report:
https://www.marketsandmarkets.com/requestsampleNew.asp?id= 226516353  

Asia Pacific likely to emerge as the largest Automotive Power Electronics Market

Asia Pacific is always seen as a revenue generating region in an automotive sector. Region comprise of technologically advanced countries like Japan, South Korea and countries with increasing populations and improving economies. Vehicles in this region are getting advanced at the backdrop of customer need and implementation of government regulations related to vehicle safety and carbon emissions. All kind of key vehicles categories like passenger vehicle, light and heavy commercial vehicles are getting advanced. Changes in the powertrain technology, inclusion of modern safety features, and technology for vehicle management are some of the key trend that is helping Asia Pacific region to dominate the market for automotive power electronics. Also, Asia Pacific is considered as key region in semiconductor space. Countries like Japan, China and Taiwan are main exporter of semiconductor components. This makes the smooth supply-chain for semiconductor supply in Asia Pacific.

The Automotive Power Electronics Market is dominated by global players such as Robert Bosch (Germany), Continental AG (Germany), Infineon (Germany), STMicroelectronics (Switzerland), ON Semiconductor (US), Danfoss (Denmark), etc. These companies have adopted strategies of new product development, expansions, collaborations, partnerships, and mergers & acquisitions to gain traction in the market. New product development was most adopted strategy among others.

Browse Related Reports:

Power Electronics Market with COVID-19 Impact Analysis by Device Type (Power Discrete, Power Module and Power ICs), Material (Silicon, Silicon Carbide and Gallium Carbide), Voltage (Low Voltage, Medium Voltage and High Voltage), Vertical (ICT, Consumer Electronics, Industrial, Automotive & Transportation, Aerospace & Defense), and Geography – Global Forecast to 2025.

Vehicle Control Unit Market by Vehicle Type, Component (Hardware & Software), Propulsion Type, Voltage (12/24V & 36/48V), Capacity (16, 32, & 64-bit), Electric Two-Wheeler, Communication Technology, Function, and Region – Global Forecast to 2027.

About MarketsandMarkets™ 

MarketsandMarkets™ provides quantified B2B research on 30,000 high growth niche opportunities/threats which will impact 70% to 80% of worldwide companies’ revenues. Currently servicing 7500 customers worldwide including 80% of global Fortune 1000 companies as clients. Almost 75,000 top officers across eight industries worldwide approach MarketsandMarkets™ for their painpoints around revenues decisions.

Our 850 fulltime analyst and SMEs at MarketsandMarkets™ are tracking global high growth markets following the «Growth Engagement Model – GEM». The GEM aims at proactive collaboration with the clients to identify new opportunities, identify most important customers, write «Attack, avoid and defend» strategies, identify sources of incremental revenues for both the company and its competitors. MarketsandMarkets™ now coming up with 1,500 MicroQuadrants (Positioning top players across leaders, emerging companies, innovators, strategic players) annually in high growth emerging segments. MarketsandMarkets™ is determined to benefit more than 10,000 companies this year for their revenue planning and help them take their innovations/disruptions early to the market by providing them research ahead of the curve.

MarketsandMarkets’ flagship competitive intelligence and market research platform, «Knowledge Store» connects over 200,000 markets and entire value chains for deeper understanding of the unmet insights along with market sizing and forecasts of niche markets.

Contact:
Mr. Aashish Mehra
MarketsandMarkets™ INC.
630 Dundee Road
Suite 430
Northbrook, IL 60062
USA: +1-888-600-6441
Email: sales@marketsandmarkets.com
Research Insight: https://www.marketsandmarkets.com/ResearchInsight/automotive-power-electronics-market.asp
Visit Our Website: https://www.marketsandmarkets.com
Content Source: https://www.marketsandmarkets.com/PressReleases/automotive-power-electronics.asp

Logo: https://mma.prnewswire.com/media/660509/MarketsandMarkets_Logo.jpg

Electric Powertrain Market Size Worth $38.16 Billion by 2027 | CAGR: 13.6%: Grand View Research, Inc.

SAN FRANCISCO, July 2, 2020 /PRNewswire/ — The global electric powertrain market size is expected to reach USD 38.16 billion by 2027, expanding at a CAGR of 13.6% from 2020 to 2027, according to a new…

SAN FRANCISCO, July 2, 2020 /PRNewswire/ — The global electric powertrain market size is expected to reach USD 38.16 billion by 2027, expanding at a CAGR of 13.6% from 2020 to 2027, according to a new report by Grand View Research, Inc. The market for the plug-in hybrid and pure electric vehicles has been growing at a significant rate, generating a high demand for automotive electric powertrains in the market. Initiatives taken by governments of various countries to promote the manufacturing of Electric Vehicles (EVs) is one of the key factors proliferating the demand for electric powertrain in the market. For instance, in 2019, the German government and auto manufacturers in the country approved to raise cash incentives under the «Environment Bonus» plan for electrically operated vehicles.

Grand View Research Logo

Increasing electric vehicle sales have compelled the prominent automotive component manufacturing companies to actively focus on catering the necessary EV components to gain a competitive advantage over other players. Companies have primarily shifted their focus on enhancing their manufacturing facilities in markets, such as Europe, China, and U.S. For instance, in February 2020, Nidec Corporation announced the investment of USD 1.8 billion to provide a push to electric vehicle powertrain business. The three new facilities in China, Poland, Mexico, would be able to deliver up to 8.4 million electric motors each year.

Key suggestions from the report:

  • By electric vehicle, the HEV/PHEVs electric vehicle segment is anticipated to register the highest CAGR of 14.0% over the forecast period owing to the more flexible option offered to its consumers as they are less concerned about recharging
  • Asia Pacific is expected to expand at the highest CAGR over the forecast period owing to increasing adoption of electric vehicles in countries, such as China and India
  • Key players operating in the market including BorgWarner, Bosch Limited, Magna International Inc.,ZF Friedrichshafen AG, and Schaeffler AG accounted for a majority market share in 2019.

Read 130 page research report with ToC on «Electric Powertrain Market Size, Share & Trends Analysis Report By Component (Battery, Motor, Power Electronics Controller), By Electric Vehicle (BEV, HEV/PHEV), By Region, And Segment Forecasts, 2020 – 2027» at: https://www.grandviewresearch.com/industry-analysis/electric-powertrain-market

The competition in the power electronics component market is high owing to the number of suppliers currently aiming to enter into the market to gain lucrative benefits. The OEMs are finding it difficult to earn profits since they need to replace an ICE powertrain with an electric powertrain, which is more costly. They would struggle to make profits with the power electronics component until they achieve significant sales. The companies are working together to achieve a competitive edge. For instance, in January 2020, GKN Automotive, an electric drivetrain specialist, announced a partnership with Delta Electronics, a thermal management solutions company. The partnership will enable the development and integration of new technologies for the new generation of e-drive systems.

The market in Asia Pacific is anticipated to grow at a significant pace during the forecast period owing to rise in demand for electric vehicles and growth in the per capita income of individuals in the region. The countries in Asia Pacific, such as China and India, are among the key producers of automobiles. Growth in the penetration of electric vehicles can be anticipated owing to increased stringency of emission norms in these countries, such as China VI and BS-VI in India, thereby fueling the regional market growth. However, the recent COVID-19 pandemic has interrupted the strong successive growth, which was achieved over the past decade. The pandemic has put the markets on hold and the world on lockdown. The transportation sector has been affected in multiple ways, with vehicle sales falling, factory shutdowns, and public transit use declining to disrupt automakers’ supply chains. Europe is a key market for electric powertrain with countries, such as Norway, Finland, Sweden, and Netherlands, having a much higher adoption of electric vehicles than in other countries. The region also holds a significant share of automotive production and the presence of several automotive OEMs is anticipated to propel the growth for the market.

Grand View Research has segmented the global electric powertrain market on the basis of component, electric vehicle, and region:

  • Electric Powertrain Component Outlook (Revenue, USD Billion, 2016 – 2027)
    • Motor/Generator
    • Battery
    • Power Electronics Controller
    • Converter
    • Transmission
    • On-board Charger
  • Electric Powertrain Electric Vehicle Outlook (Revenue, USD Billion, 2016 – 2027)
    • BEV
    • HEV/PHEV
  • Electric Powertrain Regional Outlook (Revenue, USD Billion, 2016 – 2027)
    • North America
      • U.S.
      • Canada
    • Europe
      • U.K.
      • Germany
      • Norway
      • Sweden
      • Netherlands
    • Asia Pacific
      • China
      • India
      • Japan
    • Rest of the World
  • List of Key Players of Electric Powertrain Market:
    • BorgWarner
    • Bosch Limited
    • Mitsubishi Electric Corp
    • Magna International Inc.
    • Schaeffler AG
    • ZF Friedrichshafen AG
    • Valeo
    • Nidec Corporation
    • Continental AG
    • Magneti Marelli Ck Holdings

Find more research reports on Automotive & Transportation Industry, by Grand View Research:

  • Electric Vehicle Supply Equipment Market – The market is driven by development of charging equipment and infrastructure at various highway and destination locations such as hotels, shopping malls, and national parks.
  • Automotive Collision Repair Market – Technological advancements and subsequent development of innovative repair techniques are anticipated to boost the market.
  • Business Jet Market The advent of new and technologically advanced aircraft models is expected to further fuel the growth.

Gain access to Grand View Compass, our BI enabled intuitive market research database of 10,000+ reports

About Grand View Research

Grand View Research, U.S.-based market research and consulting company, provides syndicated as well as customized research reports and consulting services. Registered in California and headquartered in San Francisco, the company comprises over 425 analysts and consultants, adding more than 1200 market research reports to its vast database each year. These reports offer in-depth analysis on 46 industries across 25 major countries worldwide. With the help of an interactive market intelligence platform, Grand View Research helps Fortune 500 companies and renowned academic institutes understand the global and regional business environment and gauge the opportunities that lie ahead.

Contact:

Sherry James
Corporate Sales Specialist, USA
Grand View Research, Inc.
Phone: +1-415-349-0058
Toll Free: 1-888-202-9519
Email: sales@grandviewresearch.com 
Web: https://www.grandviewresearch.com 
Follow Us: LinkedIn | Twitter

Logo: https://mma.prnewswire.com/media/661327/Grand_View_Research_Logo.jpg

Follow me to be Healthy with Europe: El #400gChallenge cumple un año

– La campaña Follow me to be Healthy with Europe, ya lleva un año en marcha, consiguiendo 32 milliones impresiones en las redes sociales;

– Contando con los fondos de Freshfel Europe, Aprifel y la Comisión Europea, la campaña busca aumentar el consumo de frutas y verduras entre los europeos de 18 a 30 años;

– Las colaboraciones con los influencers y retos mensuales instan a los jóvenes europeos a compartir consejos para integrar de forma sencilla la fruta y las verduras en sus dietas…

– La campaña Follow me to be Healthy with Europe, ya lleva un año en marcha, consiguiendo 32 milliones impresiones en las redes sociales;

– Contando con los fondos de Freshfel Europe, Aprifel y la Comisión Europea, la campaña busca aumentar el consumo de frutas y verduras entre los europeos de 18 a 30 años;

– Las colaboraciones con los influencers y retos mensuales instan a los jóvenes europeos a compartir consejos para integrar de forma sencilla la fruta y las verduras en sus dietas diarias

BRUSELAS, 2 de julio de 2020 /PRNewswire/ — La campaña «Follow me to be Healthy with Europe» ya ha cumplido un año. Lanzada por medio de Freshfel Europe, Aprifel y la Comisión Europea, su objetivo es instar a los jóvenes europeos a aumentar su consumo de frutas y verduras a un mínimo de 400 gramos diarios, de cara mejorar y finalmente transformar los hábitos alimenticios de los millennials.

Como iniciativa digital primero, la campaña a nivel europeo ha generado más de 32 milliones impresiones en los medios sociales en sus 12 primeros meses. Por medio de colaboraciones con influencers de los medios sociales, como Carlos Rios, la campaña ha mostrado que realizar una dieta con elevado consumo en fruta y verduras no es solo saludable, sino que también es sencilla de conseguir y divertida de llevar a cabo.

Usando el hashtag #400gChallenge, se ‘reta’ a los seguidores a incluir más fruta y verduras en su dieta diaria. Estos retos están promocionados por las infográficas mensuales, consejos y videos, que muestran que los beneficios para la salud de la fruta y verdura son directos y cercanos en los seis canales de los medios sociales de la campaña. «Se trata de una elección natural para llevar a cabo en esta primera campaña digital – como media, nuestra audiencia objetivo invierte más de una tercera parte de sus horas activas en el formato online«, indicó Philippe Binard, delegado general para Europa de Freshfel.

La parte online de la campaña, que tiene una duración prevista hasta finales del año 2021, está complementada por su presencia en los eventos. En el evento de lanzamiento llevado a cabo en el festival Eurockéennes de Belfort en julio de 2019, se distribuyó entre los asistentes al festival 1 tonelada de fruta y verduras. Los visitantes al expositor de la campaña hablaron con un dietista acerca de la importancia del consumo de fruta y verduras. «Desde que hablamos con los visitantes en nuestro expositor, quedó claro que muchos de los jóvenes no eran conscientes del amplio beneficios que supone para la salud una dieta con un elevado consumo de fruta y verduras«, comentó Mathilde Fléchard, responsable de proyecto para Europa de Aprifel.

En Europa, 1 de cada 5 adultos son obesos, y para el año 2030, se estima que más del 50% de la población europea padecerá obesidad. Según la Organización Mundial de la Salud (OMS): «La fruta y las verduras son componentes importantes de una dieta saludable»[1]. Así, la OMS recomienda el consumo de al menos 400 gramos de fruta y verdura al día. Aún con ello, los niveles de consumo de fruta y verduras de la mayor parte de los Estados Miembros de la UE siguen por debajo de este objetivo de consumo, con solo un 14% de la población de Europa cumpliendo con esta recomendación.

Este bajo consumo de frutas y verduras es muy destacable entre personas de 18 y 30 años. Por este motivo, esta campaña de concienciación europea se centra en este grupo de edades específico.

Descarga el kit de prensa digital de la campaña en español aquí: Kit de prensa digital 2020

[1] https://www.who.int/dietphysicalactivity/fruit/en/

Logo – https://mma.prnewswire.com/media/1198670/FMTBH_with_Europe_Logo.jpg

Xinhua Silk Road: Guilin, en el sur de China, presenta eventos para celebrar el Día del Patrimonio Cultural y Natural

PEKÍN, 29 de junio de 2020 /PRNewswire/ — Guilin, uno de los principales sitios turísticos de China, presentó recientemente una serie de eventos para celebrar el Día del Patrimonio Cultural y Natural, que este año cayó el 13 de junio.

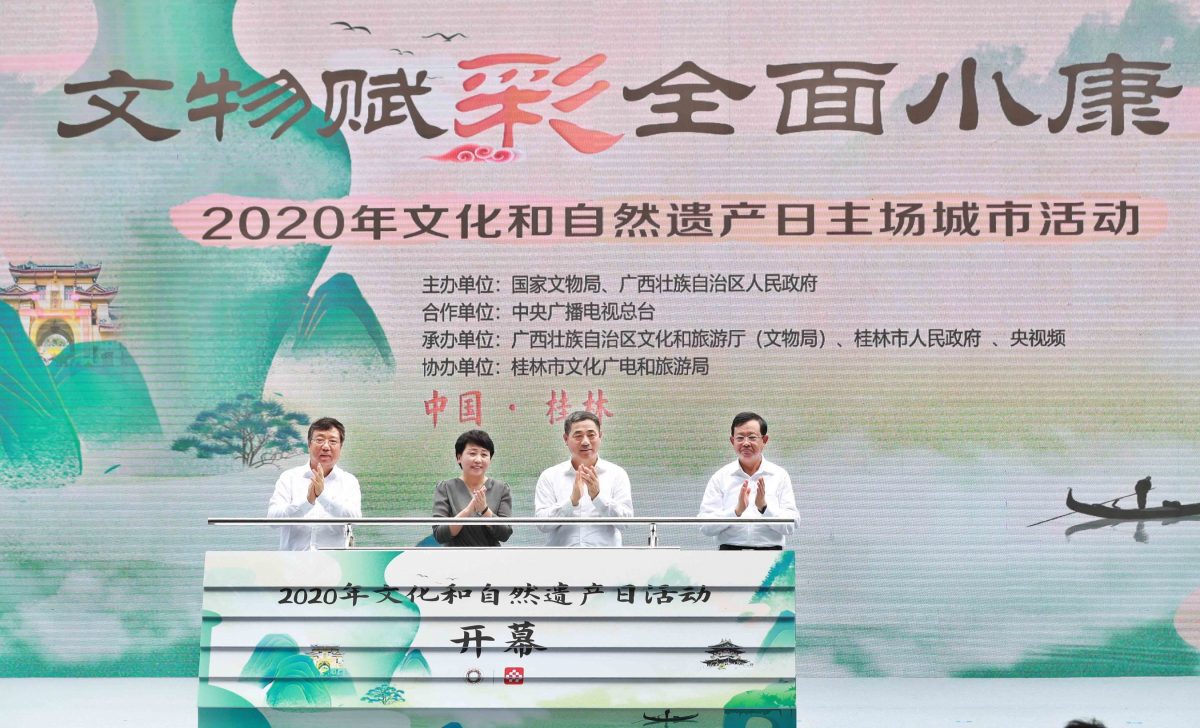
PEKÍN, 29 de junio de 2020 /PRNewswire/ — Guilin, uno de los principales sitios turísticos de China, presentó recientemente una serie de eventos para celebrar el Día del Patrimonio Cultural y Natural, que este año cayó el 13 de junio.

Foto: Comienzo de la ceremonia inaugural del Día del Patrimonio Cultural y Natural en la ciudad de Guilin, en la región autónoma zhuang de Guangxi, en el sur de China, el 13 de junio. (PRNewsfoto/Xinhua Silk Road)

En particular, se celebró un importante foro en Guilin para compartir casos sobresalientes de toda la nación, que mostraron cómo la protección del patrimonio cultural podría impulsar el turismo local y ayudar a luchar contra la pobreza.

Durante los eventos, Jinjiang, la Ciudad de los Príncipes, impresionó a los participantes por su buena protección.

Jinjiang, la Ciudad de los Príncipes, construida originalmente en 1372, cubre una superficie de aproximadamente 200.000 metros cuadrados. Fue la residencia de los príncipes durante la dinastía Ming (1368-1644). Un total de 14 príncipes de la dinastía Ming vivieron allí.

«Para volver a dar vida a Jinjiang, la Ciudad de los Príncipes, Guilin ha realizado una limpieza arqueológica con excavaciones y reparación ambiental en 11 tumbas de príncipes. Se demolieron todos los edificios ilegales construidos contra el muro de la ciudad, de modo que el antiguo muro quedó expuesto», comentó un funcionario del gobierno local.

Además de los esfuerzos gubernamentales para proteger las antigüedades naturales y culturales, la gente también se está sumando de manera individual a la campaña de protección del patrimonio cultural.

Durante los eventos, se llevó a cabo también una ceremonia de premiación para distinguir a personas individuales por sus aportes a la protección del patrimonio cultural.

Tang Yijin, un vecino de Guilin de 76 años, no ahorró esfuerzos para proteger reliquias culturales durante muchos años. En 2009 compró un grupo de antiguos edificios residenciales con características de los edificios tradicionales del norte de Guangxi y los relocalizó, evitando así su demolición por la expansión del ferrocarril.

Cuando recibió el premio, dijo emocionado: «Este honor es una recompensa y un estímulo, y en el futuro seguiré llevando adelante la causa de la protección de las reliquias culturales y la herencia como he hecho siempre».

Durante los eventos, se inauguró en Guilin un salón de experiencias de patrimonio cultural inmaterial centrado en la ópera y las artes locales.

En años recientes, la región autónoma zhuang de Guangxi, en el sur de China, ha incrementado continuamente la protección y la inversión en el patrimonio cultural.

Desde 2018 Guangxi lanzó la construcción de museos especiales. Según un funcionario del Departamento de Cultura y Turismo de la región, la cantidad de museos en la región ha llegado a 252, con casi 20 millones de visitantes por año. (Editado por Hu Pingchao con Xinhua Silk Road, hupingchao@xinhua.org).

Foto – https://mma.prnewswire.com/media/1197395/Cultural_and_Natural_Heritage_Day.jpg

FUENTE Xinhua Silk Road

Xinhua Silk Road: Guilin, en el sur de China, presenta eventos para celebrar el Día del Patrimonio Cultural y Natural

PEKÍN, 29 de junio de 2020 /PRNewswire/ — Guilin, uno de los principales sitios turísticos de China, presentó recientemente una serie de eventos para celebrar el Día del Patrimonio Cultural y Natural, que este año cayó el 13 de junio.

PEKÍN, 29 de junio de 2020 /PRNewswire/ — Guilin, uno de los principales sitios turísticos de China, presentó recientemente una serie de eventos para celebrar el Día del Patrimonio Cultural y Natural, que este año cayó el 13 de junio.

Foto: Comienzo de la ceremonia inaugural del Día del Patrimonio Cultural y Natural en la ciudad de Guilin, en la región autónoma zhuang de Guangxi, en el sur de China, el 13 de junio. (PRNewsfoto/Xinhua Silk Road)

En particular, se celebró un importante foro en Guilin para compartir casos sobresalientes de toda la nación, que mostraron cómo la protección del patrimonio cultural podría impulsar el turismo local y ayudar a luchar contra la pobreza.

Durante los eventos, Jinjiang, la Ciudad de los Príncipes, impresionó a los participantes por su buena protección.

Jinjiang, la Ciudad de los Príncipes, construida originalmente en 1372, cubre una superficie de aproximadamente 200.000 metros cuadrados. Fue la residencia de los príncipes durante la dinastía Ming (1368-1644). Un total de 14 príncipes de la dinastía Ming vivieron allí.

«Para volver a dar vida a Jinjiang, la Ciudad de los Príncipes, Guilin ha realizado una limpieza arqueológica con excavaciones y reparación ambiental en 11 tumbas de príncipes. Se demolieron todos los edificios ilegales construidos contra el muro de la ciudad, de modo que el antiguo muro quedó expuesto», comentó un funcionario del gobierno local.

Además de los esfuerzos gubernamentales para proteger las antigüedades naturales y culturales, la gente también se está sumando de manera individual a la campaña de protección del patrimonio cultural.

Durante los eventos, se llevó a cabo también una ceremonia de premiación para distinguir a personas individuales por sus aportes a la protección del patrimonio cultural.

Tang Yijin, un vecino de Guilin de 76 años, no ahorró esfuerzos para proteger reliquias culturales durante muchos años. En 2009 compró un grupo de antiguos edificios residenciales con características de los edificios tradicionales del norte de Guangxi y los relocalizó, evitando así su demolición por la expansión del ferrocarril.

Cuando recibió el premio, dijo emocionado: «Este honor es una recompensa y un estímulo, y en el futuro seguiré llevando adelante la causa de la protección de las reliquias culturales y la herencia como he hecho siempre».

Durante los eventos, se inauguró en Guilin un salón de experiencias de patrimonio cultural inmaterial centrado en la ópera y las artes locales.

En años recientes, la región autónoma zhuang de Guangxi, en el sur de China, ha incrementado continuamente la protección y la inversión en el patrimonio cultural.

Desde 2018 Guangxi lanzó la construcción de museos especiales. Según un funcionario del Departamento de Cultura y Turismo de la región, la cantidad de museos en la región ha llegado a 252, con casi 20 millones de visitantes por año. (Editado por Hu Pingchao con Xinhua Silk Road, hupingchao@xinhua.org).

Foto – https://mma.prnewswire.com/media/1197395/Cultural_and_Natural_Heritage_Day.jpg

FUENTE Xinhua Silk Road

«WONDERLITE (TM) Dx», de AGC, se estrena a nivel mundial en el nuevo Harrier de Toyota

–  El cristal de control de luz de AGC, «WONDERLITE (TM) Dx», se estrena a nivel mundial en el nuevo Harrier de Toyota

TOKIO, 2 de julio de 2020 /PRNewswire/ — AGC Inc. ha anunciado su cristal de control de luz, «WONDERLITE (TM) Dx», que se ha utilizado en el techo solar panorámico del nuevo Harrier de Toyota, con lanzamiento realizado el 17 de junio de 2020. Cuando se utiliza como cristal exterior del vehículo, este producto presenta el tiempo de respuesta más rápido del mundo (*1), permitiendo un control…

–  El cristal de control de luz de AGC, «WONDERLITE (TM) Dx», se estrena a nivel mundial en el nuevo Harrier de Toyota

TOKIO, 2 de julio de 2020 /PRNewswire/ — AGC Inc. ha anunciado su cristal de control de luz, «WONDERLITE (TM) Dx», que se ha utilizado en el techo solar panorámico del nuevo Harrier de Toyota, con lanzamiento realizado el 17 de junio de 2020. Cuando se utiliza como cristal exterior del vehículo, este producto presenta el tiempo de respuesta más rápido del mundo (*1), permitiendo un control instantáneo de la transmisión de la luz. Esta cifra marca la primera adopción a nivel mundial (*1) del producto en un vehículo de producción en masa.

El cristal de control de luz de AGC, WONDERLITE (TM) Dx, está compuesto por una película especializada encapsulada entre capas de cristal de automoción laminadas inter-laminadas. Al reducir el deslumbramiento del sol en su modo atenuado (estado opaco) y proporcionar un amplio sentido de apertura en su modo transparente (estado claro), el producto consigue un interior de vehículo que permite una iluminación agradable que entra desde el techo solar panorámico siempre que el usuario lo desea.

Logo: https://kyodonewsprwire.jp/img/202006170973-O1-J4ya4Do9

Imagen 1: Modo atenuado (estado opaco) (*2) https://kyodonewsprwire.jp/prwfile/release/M000303/202006170973/_prw_PI2fl_7S1299Bm.jpg

Imagen 2: Modo transparente (estado claro) (*2) https://kyodonewsprwire.jp/prwfile/release/M000303/202006170973/_prw_PI3fl_R3c413jz.jpg

Bajo su política de administración «AGC plus», AGC Group ha puesto en marcha el compromiso de crear productos que añaden varios añadidos para los accionistas. Entre los añadidos para la sociedad están la «seguridad», «prevención» y «comodidad», mientras que los añadidos para los clientes incluyen el «nuevo valor» y «funcionalidad». AGC se dedica a buscar las innovaciones tecnológicas que la permiten seguir proporcionando productos que añaden un nuevo valor y superan las expectativas de los clientes.

Notas:

(*1): Basándose en la investigación de AGC.
(*2): Las fotos no representan el techo solar panorámico del nuevo modelo Harrier.

REFERENCIA

Características técnicas del cristal de control de luz «WONDERLITE (TM) Dx»

– Estructura

Imagen 3: https://kyodonewsprwire.jp/img/202006170973-O4-de68Lr14

El cristal de control de luz está formado por una película especializada (*3) integrada entre las capas inter-laminadas en un cristal de automoción laminado. La película está contenida dentro del paquete que cuenta con un material especial que es demasiado pequeño para ser captado a simple vista. Casi el 99% de los rayos ultravioletas son bloqueados en el modo transparente y atenuado (*4).

Notas:

(*3): Película especial creada por Kyusyu Nanotec Optics Co., Ltd.
(*4): Basado en los estándares ISO9050

– El voltaje del mecanismo se utiliza para controlar la distribución y orientación del material especial en la película integrada entre las capas del inter-laminado en cristal de automoción laminado, lo que permite un intercambio instantáneo entre el modo transparente y el modo atenuado.

Imagen 4: Modo atenuado (estado opaco, cuando se desconecta) https://kyodonewsprwire.jp/prwfile/release/M000303/202006170973/_prw_PI5lg_K8AH6A7f.jpg

Imagen 5: Modo transparente (estado claro, cuando se conecta) https://kyodonewsprwire.jp/prwfile/release/M000303/202006170973/_prw_PI6lg_2hMe5nbf.jpg


Continúa la recuperación de las ventas de American Honda pese a cuestiones de inventario y desafíos empresariales debido a la COVID-19

La estabilidad de las ventas refleja una buena demanda; la variabilidad de los suministros limita el potencial 

TORRANCE, California, 1 de julio de 2020 /PRNewswire-HISPANIC PR WIRE/ —

   …

La estabilidad de las ventas refleja una buena demanda; la variabilidad de los suministros limita el potencial 

TORRANCE, California, 1 de julio de 2020 /PRNewswire-HISPANIC PR WIRE/ —


American Honda 

Honda 

Acura 

Total 

Autos

Camionetas

Total 

Autos

Camionetas

Total 

Autos

Camionetas

T2 

293,502

122,665

170,837

27,458

6,828

20,630

266,044

115,837

150,207

-27.9%

-34.5%

-22.3%

-26.5%

-33.8%

-23.8%

-28.1%

-34.5%

-22.1%

Total 

Autos

Camionetas

Total 

Autos

Camionetas

Total 

Autos

Camionetas 

Junio 

114,774

45,886

68,888

12,071

2,684

9,387

102,703

43,202

59,501

-15.5%

-25.9%

-6.9%

-0.6%

-15.9%

4.8%

-17%

-26.4%

-8.5%

«Hemos vuelto a las operaciones comerciales con ventas de abril a junio más sólidas de lo que podríamos haber esperado, con el ritmo de la recuperación en franca aceleración en la segunda mitad del trimestre. Estamos un poco a la baja en inventario, pero nuestros distribuidores han sido notablemente flexibles y se han adaptado a uno de los mayores desafíos que nuestra industria haya visto jamás, y nuestro equipo de producción trabaja días extra esta semana para estar a la altura de la demanda de nuestros clientes. Ahora anticipamos con ansiedad la llegada del totalmente nuevo Acura TLX para llevar auténtica emoción a los pisos de exhibición de Acura», dijo Dave Gardner, vicepresidente ejecutivo de Ventas Automotrices de American Honda Motor Co., Inc.

American Honda brinda apoyo en tiempos de la COVID-19: Las marcas Honda y Acura ofrecen al personal de primera línea y los profesionales de la salud que cubran los requisitos un descuento de $1,000 en vehículos nuevos financiados o en leasing a través de los Servicios Financieros Honda o los Servicios Financieros Acura hasta el 6 de julio inclusive.

HONDA 

INFORME DE MARCA 

Lo más destacado de las ventas 

Notas 

Las ventas de junio dieron continuidad a la recuperación iniciada en mayo, aunque algunas cuestiones de suministro limitaron el potencial de ventas en varios frentes. Aun así, las ventas de camionetas se situaron dentro del 8.5% de junio de 2019.

  • Las ventas del Pilot superaron las de junio de 2019: aumentaron 4.7% al vender 12,128 unidades.
  • El CR-V tuvo un fuerte desempeño al registrar ventas de 26,488 vehículos.
  • El Civic sigue liderando la industria en el segmento de ventas minoristas de autos para pasajeros en 2020, fortalecido por las ventas de 23,260 unidades en junio.

Honda ocupa el puesto #1 en los Estados Unidos con la flotilla de mayor promedio de economía de combustible y menores emisiones de CO2 entre todos los fabricantes de vehículos de línea completa.


ACURA 

INFORME DE MARCA

Lo más destacado de las ventas 

Notas 

Las ventas de Acura volvieron a un ritmo normal en junio, prácticamente equiparándose con las ventas previas de junio, con las camionetas a la vanguardia.

  • Las ventas de camionetas Acura aumentaron 4.8% en total en junio.
  • El RDX vio su mes más sólido en ventas desde diciembre al aumentar 11.1% en relación con junio de 2019 y vender 5,410 unidades.
  • Las entregas de MDX alcanzaron la cifra de 3,977 en el mes; también es el mejor resultado de ventas desde diciembre.

El totalmente nuevo Acura TLX 2021 llega anticipadamente este otoño como el sedán más veloz, de mejor manejo y más equipado de la marca en sus 35 años de historia. El nuevo modelo debutó digitalmente el 28 de mayo y fue recibido con entusiasmo entre distribuidores y potenciales clientes.


Ventas de vehículos de American Honda para junio de 2020 

Mes a la fecha 

Año a la fecha 

Junio de 2020 

Junio de 2019 

% de

cambio

de TDV**

% de

cambio
mes a mes
 

Junio de 2020 

Junio de 2019 

% de

cambio

de TDV**

% de
cambio

año a año

American Honda Total 

114,774

135,901

-12.2%

-15.5%

592,287

776,995

-23.8%

-23.8%

Total de ventas de automóviles

45,886

61,899

-22.9%

-25.9%

254,510

356,310

-28.6%

-28.6%

Total de ventas de camionetas

68,888

74,002

-3.2%

-6.9%

337,777

420,685

-19.7%

-19.7%

Honda 

Total de ventas de automóviles

43,202

58,706

-23.5%

-26.4%

239,244

335,358

-28.7%

-28.7%

Honda 

Total de ventas de camionetas

59,501

65,047

-4.9%

-8.5%

297,053

367,870

-19.3%

-19.3%

Acura 

Total de ventas de automóviles 

2,684

3,193

-12.6%

-15.9%

15,266

20,952

-27.1%

-27.1%

Acura 

Total de ventas de camionetas 

9,387

8,955

9.0%

4.8%

40,724

52,815

-22.9%

-22.9%

* Total de ventas de automóviles nacionales

39,850

53,061

-21.9%

-24.9%

221,429

293,354

-24.5%

-24.5%

División Honda

37,292

49,918

-22.3%

-25.3%

206,565

273,075

-24.4%

-24.4%

División Acura

2,558

3,143

-15.4%

-18.6%

14,864

20,279

-26.7%

-26.7%

* Total de ventas de camionetas nacionales

68,861

72,419

-1.1%

-4.9%

337,162

405,307

-16.8%

-16.8%

División Honda

59,474

63,464

-2.5%

-6.3%

296,438

352,492

-15.9%

-15.9%

División Acura

9,387

8,955

9.0%

4.8%

40,724

52,815

-22.9%

-22.9%

 Total de ventas de automóviles importados

6,036

8,838

-29.0%

-31.7%

33,081

62,956

-47.5%

-47.5%

División Honda

5,910

8,788

-30.1%

-32.7%

32,679

62,283

-47.5%

-47.5%

División Acura

126

50

162.1%

152.0%

402

673

-40.3%

-40.3%

 Total de ventas de camionetas importadas

27

1,583

-98.2%

-98.3%

615

15,378

-96.0%

-96.0%

División Honda

27

1,583

-98.2%

-98.3%

615

15,378

-96.0%

-96.0%

División Acura

0

0

0.0%

0.0%

0

0

0.0%

0.0%

 DESGLOSE DE MODELOS POR DIVISIÓN

Total de la división Honda

102,703

123,753

-13.7%

-17.0%

536,297

703,228

-23.7%

-23.7%

ACCORD 

15,409

21,893

-26.8%

-29.6%

88,754

129,435

-31.4%

-31.4%

CIVIC 

23,260

29,751

-18.7%

-21.8%

127,858

169,172

-24.4%

-24.4%

CLARITY 

187

1,092

-82.2%

-82.9%

1,780

7,045

-74.7%

-74.7%

CR-Z 

0

0

0.0%

0.0%

1

2

-50.0%

-50.0%

FIT 

2,923

3,603

-15.6%

-18.9%

13,887

17,156

-19.1%

-19.1%

INSIGHT 

1,423

2,367

-37.5%

-39.9%

6,964

12,548

-44.5%

-44.5%

CR-V 

26,488

30,427

-9.5%

-12.9%

138,898

176,944

-21.5%

-21.5%

HR-V 

7,512

7,693

1.6%

-2.4%

36,895

45,179

-18.3%

-18.3%

ODYSSEY 

7,946

9,202

-10.2%

-13.6%

35,917

47,500

-24.4%

-24.4%

PASSPORT 

3,060

3,385

-6.0%

-9.6%

16,023

14,540

10.2%

10.2%

PILOT 

12,128

11,579

8.9%

4.7%

54,815

68,452

-19.9%

-19.9%

RIDGELINE 

2,367

2,761

-10.8%

-14.3%

14,505

15,255

-4.9%

-4.9%

Total de la división Acura

12,071

12,148

3.3%

-0.6%

55,990

73,767

-24.1%

-24.1%

ILX 

1,109

1,312

-12.1%

-15.5%

5,395

6,956

-22.4%

-22.4%

NSX 

10

19

-45.3%

-47.4%

55

151

-63.6%

-63.6%

RLX / RL 

126

50

162.1%

152.0%

402

673

-40.3%

-40.3%

TLX 

1,439

1,812

-17.4%

-20.6%

9,414

13,172

-28.5%

-28.5%

MDX 

3,977

4,087

1.2%

-2.7%

17,974

22,634

-20.6%

-20.6%

RDX 

5,410

4,868

15.6%

11.1%

22,750

30,181

-24.6%

-24.6%

Días de venta 

25

26

153

153

**** Vehículos eléctricos 

5,086

5,800

-8.8%

-12.3%

21,995

32,437

-32.2%

-32.2%

* Los vehículos Honda y Acura se ensamblan con partes nacionales e importadas

** Tasa diaria de ventas

**** La categoría de vehículos eléctricos incluye: total de ventas de híbridos (FHEV y PHEV), vehículos eléctricos (BEV) y vehículos de celda de combustible (FCV) de las marcas Honda y Acura.


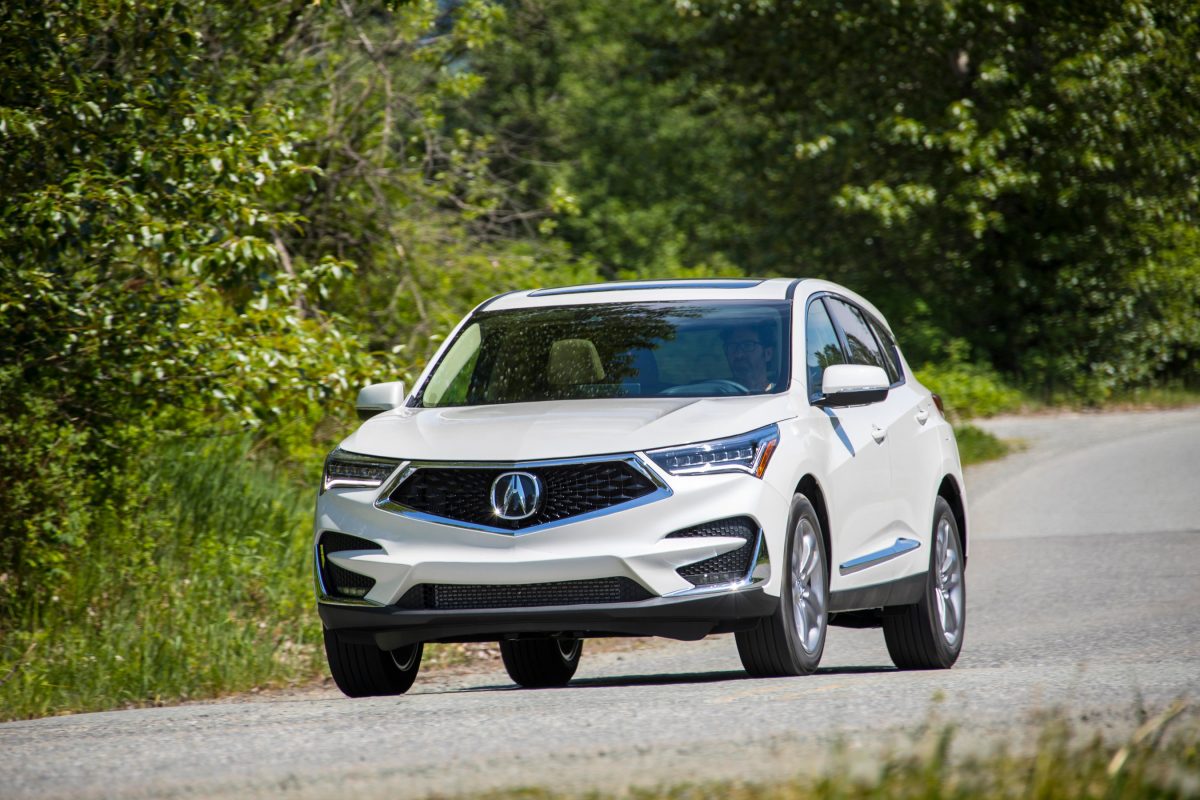
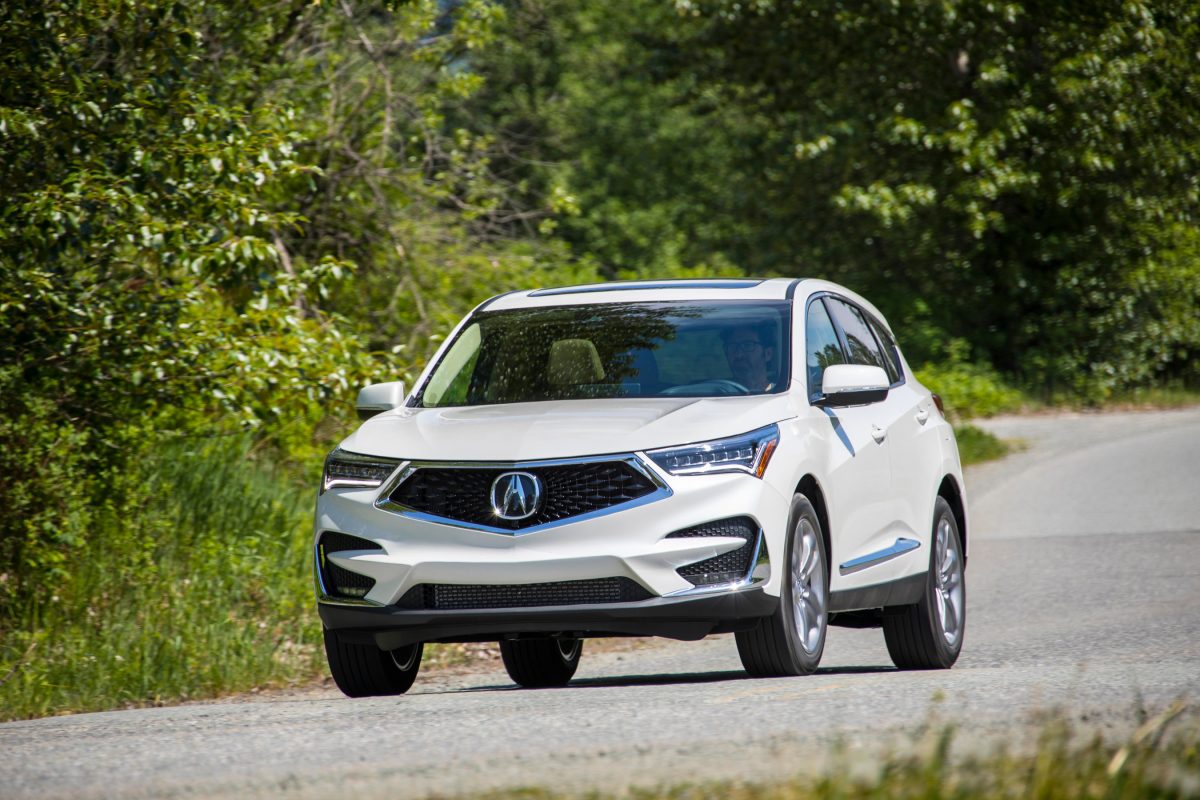
American Honda announced June/Q2 sales results today. Acura June sales virtually matched the same month in 2019, with an especially good performance from RDX which gained 11 percent for the month. (PRNewsfoto/American Honda Motor Co., Inc.)


Honda Logo. (PRNewsFoto/American Honda Motor Co., Inc.) (PRNewsfoto/American Honda Motor Co., Inc.)

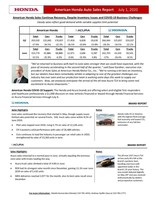
PDF – https://mma.prnewswire.com/media/1199339/Honda_June_2020_Sales.pdf 
Foto – https://mma.prnewswire.com/media/1199340/Honda_2019_Acura_RDX_Advance.jpg
Logo – https://mma.prnewswire.com/media/477245/HONDALOGO_Logo.jpg

FUENTE American Honda Motor Co., Inc.

Continúa la recuperación de las ventas de American Honda pese a cuestiones de inventario y desafíos empresariales debido a la COVID-19

La estabilidad de las ventas refleja una buena demanda; la variabilidad de los suministros limita el potencial 

TORRANCE, California, 1 de julio de 2020 /PRNewswire-HISPANIC PR WIRE/ —

   …

La estabilidad de las ventas refleja una buena demanda; la variabilidad de los suministros limita el potencial 

TORRANCE, California, 1 de julio de 2020 /PRNewswire-HISPANIC PR WIRE/ —


American Honda 

Honda 

Acura 

Total 

Autos

Camionetas

Total 

Autos

Camionetas

Total 

Autos

Camionetas

T2 

293,502

122,665

170,837

27,458

6,828

20,630

266,044

115,837

150,207

-27.9%

-34.5%

-22.3%

-26.5%

-33.8%

-23.8%

-28.1%

-34.5%

-22.1%

Total 

Autos

Camionetas

Total 

Autos

Camionetas

Total 

Autos

Camionetas 

Junio 

114,774

45,886

68,888

12,071

2,684

9,387

102,703

43,202

59,501

-15.5%

-25.9%

-6.9%

-0.6%

-15.9%

4.8%

-17%

-26.4%

-8.5%

«Hemos vuelto a las operaciones comerciales con ventas de abril a junio más sólidas de lo que podríamos haber esperado, con el ritmo de la recuperación en franca aceleración en la segunda mitad del trimestre. Estamos un poco a la baja en inventario, pero nuestros distribuidores han sido notablemente flexibles y se han adaptado a uno de los mayores desafíos que nuestra industria haya visto jamás, y nuestro equipo de producción trabaja días extra esta semana para estar a la altura de la demanda de nuestros clientes. Ahora anticipamos con ansiedad la llegada del totalmente nuevo Acura TLX para llevar auténtica emoción a los pisos de exhibición de Acura», dijo Dave Gardner, vicepresidente ejecutivo de Ventas Automotrices de American Honda Motor Co., Inc.

American Honda brinda apoyo en tiempos de la COVID-19: Las marcas Honda y Acura ofrecen al personal de primera línea y los profesionales de la salud que cubran los requisitos un descuento de $1,000 en vehículos nuevos financiados o en leasing a través de los Servicios Financieros Honda o los Servicios Financieros Acura hasta el 6 de julio inclusive.

HONDA 

INFORME DE MARCA 

Lo más destacado de las ventas 

Notas 

Las ventas de junio dieron continuidad a la recuperación iniciada en mayo, aunque algunas cuestiones de suministro limitaron el potencial de ventas en varios frentes. Aun así, las ventas de camionetas se situaron dentro del 8.5% de junio de 2019.

  • Las ventas del Pilot superaron las de junio de 2019: aumentaron 4.7% al vender 12,128 unidades.
  • El CR-V tuvo un fuerte desempeño al registrar ventas de 26,488 vehículos.
  • El Civic sigue liderando la industria en el segmento de ventas minoristas de autos para pasajeros en 2020, fortalecido por las ventas de 23,260 unidades en junio.

Honda ocupa el puesto #1 en los Estados Unidos con la flotilla de mayor promedio de economía de combustible y menores emisiones de CO2 entre todos los fabricantes de vehículos de línea completa.


ACURA 

INFORME DE MARCA

Lo más destacado de las ventas 

Notas 

Las ventas de Acura volvieron a un ritmo normal en junio, prácticamente equiparándose con las ventas previas de junio, con las camionetas a la vanguardia.

  • Las ventas de camionetas Acura aumentaron 4.8% en total en junio.
  • El RDX vio su mes más sólido en ventas desde diciembre al aumentar 11.1% en relación con junio de 2019 y vender 5,410 unidades.
  • Las entregas de MDX alcanzaron la cifra de 3,977 en el mes; también es el mejor resultado de ventas desde diciembre.

El totalmente nuevo Acura TLX 2021 llega anticipadamente este otoño como el sedán más veloz, de mejor manejo y más equipado de la marca en sus 35 años de historia. El nuevo modelo debutó digitalmente el 28 de mayo y fue recibido con entusiasmo entre distribuidores y potenciales clientes.


Ventas de vehículos de American Honda para junio de 2020 

Mes a la fecha 

Año a la fecha 

Junio de 2020 

Junio de 2019 

% de

cambio

de TDV**

% de

cambio
mes a mes
 

Junio de 2020 

Junio de 2019 

% de

cambio

de TDV**

% de
cambio

año a año

American Honda Total 

114,774

135,901

-12.2%

-15.5%

592,287

776,995

-23.8%

-23.8%

Total de ventas de automóviles

45,886

61,899

-22.9%

-25.9%

254,510

356,310

-28.6%

-28.6%

Total de ventas de camionetas

68,888

74,002

-3.2%

-6.9%

337,777

420,685

-19.7%

-19.7%

Honda 

Total de ventas de automóviles

43,202

58,706

-23.5%

-26.4%

239,244

335,358

-28.7%

-28.7%

Honda 

Total de ventas de camionetas

59,501

65,047

-4.9%

-8.5%

297,053

367,870

-19.3%

-19.3%

Acura 

Total de ventas de automóviles 

2,684

3,193

-12.6%

-15.9%

15,266

20,952

-27.1%

-27.1%

Acura 

Total de ventas de camionetas 

9,387

8,955

9.0%

4.8%

40,724

52,815

-22.9%

-22.9%

* Total de ventas de automóviles nacionales

39,850

53,061

-21.9%

-24.9%

221,429

293,354

-24.5%

-24.5%

División Honda

37,292

49,918

-22.3%

-25.3%

206,565

273,075

-24.4%

-24.4%

División Acura

2,558

3,143

-15.4%

-18.6%

14,864

20,279

-26.7%

-26.7%

* Total de ventas de camionetas nacionales

68,861

72,419

-1.1%

-4.9%

337,162

405,307

-16.8%

-16.8%

División Honda

59,474

63,464

-2.5%

-6.3%

296,438

352,492

-15.9%

-15.9%

División Acura

9,387

8,955

9.0%

4.8%

40,724

52,815

-22.9%

-22.9%

 Total de ventas de automóviles importados

6,036

8,838

-29.0%

-31.7%

33,081

62,956

-47.5%

-47.5%

División Honda

5,910

8,788

-30.1%

-32.7%

32,679

62,283

-47.5%

-47.5%

División Acura

126

50

162.1%

152.0%

402

673

-40.3%

-40.3%

 Total de ventas de camionetas importadas

27

1,583

-98.2%

-98.3%

615

15,378

-96.0%

-96.0%

División Honda

27

1,583

-98.2%

-98.3%

615

15,378

-96.0%

-96.0%

División Acura

0

0

0.0%

0.0%

0

0

0.0%

0.0%

 DESGLOSE DE MODELOS POR DIVISIÓN

Total de la división Honda

102,703

123,753

-13.7%

-17.0%

536,297

703,228

-23.7%

-23.7%

ACCORD 

15,409

21,893

-26.8%

-29.6%

88,754

129,435

-31.4%

-31.4%

CIVIC 

23,260

29,751

-18.7%

-21.8%

127,858

169,172

-24.4%

-24.4%

CLARITY 

187

1,092

-82.2%

-82.9%

1,780

7,045

-74.7%

-74.7%

CR-Z 

0

0

0.0%

0.0%

1

2

-50.0%

-50.0%

FIT 

2,923

3,603

-15.6%

-18.9%

13,887

17,156

-19.1%

-19.1%

INSIGHT 

1,423

2,367

-37.5%

-39.9%

6,964

12,548

-44.5%

-44.5%

CR-V 

26,488

30,427

-9.5%

-12.9%

138,898

176,944

-21.5%

-21.5%

HR-V 

7,512

7,693

1.6%

-2.4%

36,895

45,179

-18.3%

-18.3%

ODYSSEY 

7,946

9,202

-10.2%

-13.6%

35,917

47,500

-24.4%

-24.4%

PASSPORT 

3,060

3,385

-6.0%

-9.6%

16,023

14,540

10.2%

10.2%

PILOT 

12,128

11,579

8.9%

4.7%

54,815

68,452

-19.9%

-19.9%

RIDGELINE 

2,367

2,761

-10.8%

-14.3%

14,505

15,255

-4.9%

-4.9%

Total de la división Acura

12,071

12,148

3.3%

-0.6%

55,990

73,767

-24.1%

-24.1%

ILX 

1,109

1,312

-12.1%

-15.5%

5,395

6,956

-22.4%

-22.4%

NSX 

10

19

-45.3%

-47.4%

55

151

-63.6%

-63.6%

RLX / RL 

126

50

162.1%

152.0%

402

673

-40.3%

-40.3%

TLX 

1,439

1,812

-17.4%

-20.6%

9,414

13,172

-28.5%

-28.5%

MDX 

3,977

4,087

1.2%

-2.7%

17,974

22,634

-20.6%

-20.6%

RDX 

5,410

4,868

15.6%

11.1%

22,750

30,181

-24.6%

-24.6%

Días de venta 

25

26

153

153

**** Vehículos eléctricos 

5,086

5,800

-8.8%

-12.3%

21,995

32,437

-32.2%

-32.2%

* Los vehículos Honda y Acura se ensamblan con partes nacionales e importadas

** Tasa diaria de ventas

**** La categoría de vehículos eléctricos incluye: total de ventas de híbridos (FHEV y PHEV), vehículos eléctricos (BEV) y vehículos de celda de combustible (FCV) de las marcas Honda y Acura.


American Honda announced June/Q2 sales results today. Acura June sales virtually matched the same month in 2019, with an especially good performance from RDX which gained 11 percent for the month. (PRNewsfoto/American Honda Motor Co., Inc.)


Honda Logo. (PRNewsFoto/American Honda Motor Co., Inc.) (PRNewsfoto/American Honda Motor Co., Inc.)

PDF – https://mma.prnewswire.com/media/1199339/Honda_June_2020_Sales.pdf 
Foto – https://mma.prnewswire.com/media/1199340/Honda_2019_Acura_RDX_Advance.jpg
Logo – https://mma.prnewswire.com/media/477245/HONDALOGO_Logo.jpg

FUENTE American Honda Motor Co., Inc.