VegasSlotsOnline News Analysis: How a Pandemic Affected Casino Markets Across the Globe

LAS VEGAS, Feb. 23, 2021 /PRNewswire/ — New VegasSlotsOnline News analysis shows that the world’s casino operators faced serious challenges throughout 2020 in the wake of COVID-19. Key takeaways:

  • Revenue fell 31% for US casinos, 79% in Macau, 33% for Europe land-based gaming
  • Nevada, the home of US gambling, saw 2020 gaming revenue plummet as restrictions took…

LAS VEGAS, Feb. 23, 2021 /PRNewswire/ — New VegasSlotsOnline News analysis shows that the world’s casino operators faced serious challenges throughout 2020 in the wake of COVID-19. Key takeaways:

  • Revenue fell 31% for US casinos, 79% in Macau, 33% for Europe land-based gaming
  • Nevada, the home of US gambling, saw 2020 gaming revenue plummet as restrictions took effect

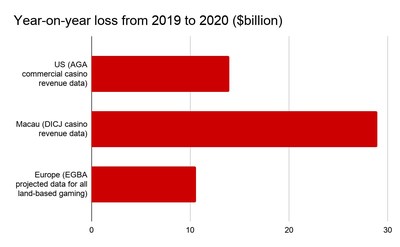
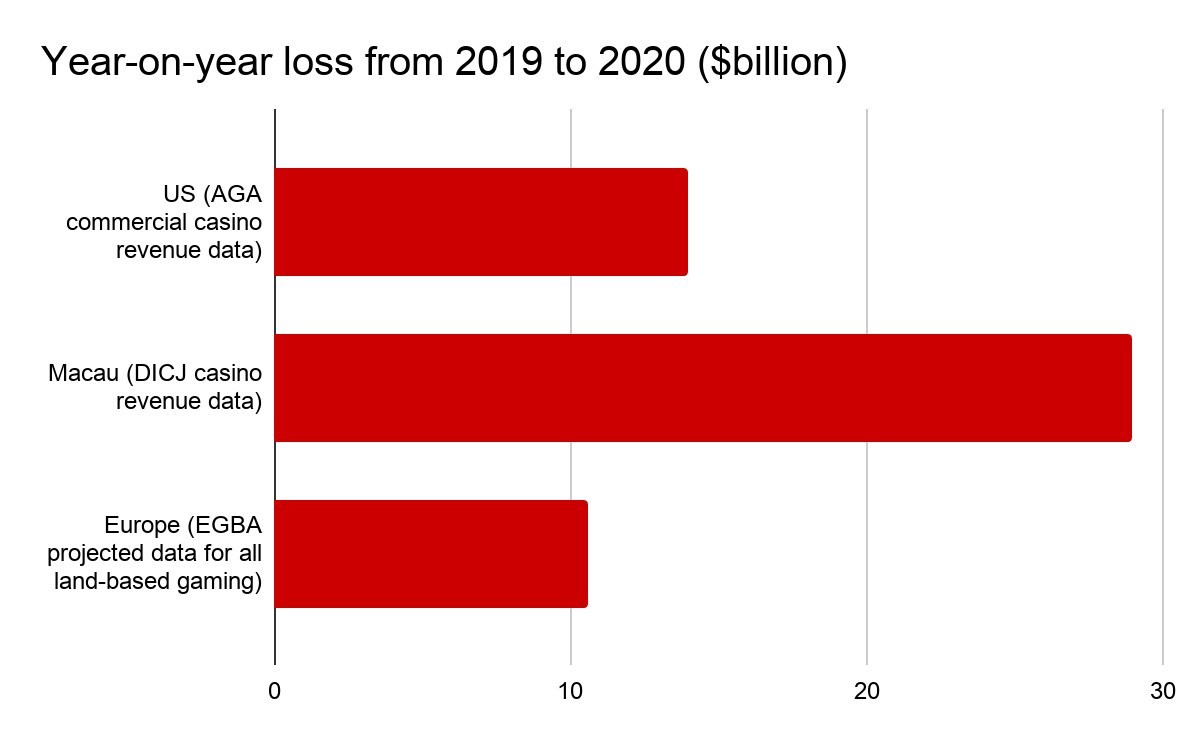
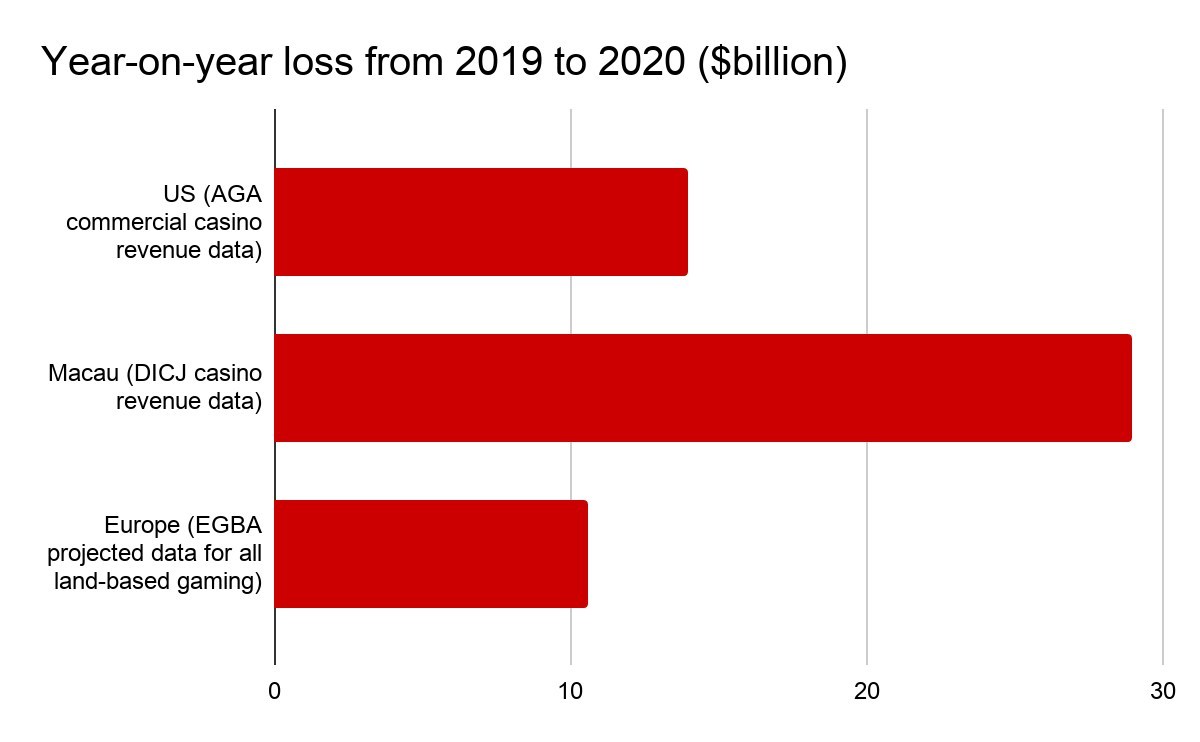
According to the latest American Gaming Association data, total US commercial gaming revenue fell by 31% for the year, to $30bn. Meanwhile, Macau venues posted total revenue of $7.57bn, showing a staggering 79% year-on-year decline. Overall, the market was down $28.93bn, dwarfing US total losses.

Revenue data from various sources shows that land-based casino revenue loss in the US, Macau, and Europe combined exceeds 50 billion USD in 2020 compared to 2019.

Europe’s operators seemingly fared best out of the three markets, losing an estimated $10.6bn from 2019 levels. Still, EGBA projections for 2020 land-based gaming revenue indicate a considerable 33% year-on-year drop.

Vegas an indicator of US struggles

In Las Vegas, the impact of the March casino closures became evident as Nevada posted its worst full-year GGR since 1996. The Strip saw its worst full month in 27 years last December. Across the US, Pennsylvania gaming revenue fell 22% for 2020, while New Jersey posted a drop of 17%.

There is now hope for a casino market rebound as restrictions gradually lift. Betfred executive Stephen A. Crystal predicts Vegas’s return to growth in under two years, while MGM CEO Bill Hornbuckle anticipates a 90% recovery in resort business by 2022.

Cracks widen in Macau

Despite Macau casinos closing for just two weeks in February 2020, they struggled with border restrictions imposed by COVID-19. The region saw only 250,000 visitors in the month after casinos reopened, down 92% year-on-year. Visitor numbers have remained low.

Las Vegas Sands’ Macau GGR fell 81% in 2020 to $1.7bn, as MGM’s and Wynn Resorts’ Macau operations saw full-year declines of 78% and 89%. The gambling hub ended the year with its worst gaming revenue since 2010. JP Morgan analysts predict a return to 2019 gaming revenue levels in Q3 2021, while Morgan Stanley forecasts a return to growth in the full-year revenue of 2022.

UK lockdowns clip casino wings

UK Prime Minister Boris Johnson ordered the shuttering of casinos in March 2020, with facilities remaining closed for almost five months after the first lockdown. Constant delays to reopening proved expensive for operators across the country, forcing Genting UK to permanently close down casinos and all live poker rooms.

As the region remains under full lockdown conditions, the Betting and Gaming Council has urged the UK government not to exclude casinos from upcoming reopening plans.

Read the full analysis by Owain Flanders in the VegasSlotsOnline News section.

About Us:

The VegasSlotsOnline News section has become a respected source of gambling news since launching in 2018. With a primary focus on the US and UK markets, we publish daily updates from all corners of the industry, including gambling legislation, casino, poker, sports betting, and iGaming.

Infographic – https://mma.prnewswire.com/media/1442930/VegasSlotsOnline_2020_Infographic.jpg


Cision View original content to download multimedia:http://www.prnewswire.com/news-releases/vegasslotsonline-news-analysis-how-a-pandemic-affected-casino-markets-across-the-globe-301233581.html

SOURCE VegasSlotsOnline

VegasSlotsOnline News Analysis: How a Pandemic Affected Casino Markets Across the Globe

LAS VEGAS, Feb. 23, 2021 /PRNewswire/ — New VegasSlotsOnline News analysis shows that the world’s casino operators faced serious challenges throughout 2020 in the wake of COVID-19. Key takeaways:

  • Revenue fell 31% for US casinos, 79% in Macau, 33% for Europe land-based gaming
  • Nevada, the home of US gambling, saw 2020 gaming revenue plummet as restrictions took…

LAS VEGAS, Feb. 23, 2021 /PRNewswire/ — New VegasSlotsOnline News analysis shows that the world’s casino operators faced serious challenges throughout 2020 in the wake of COVID-19. Key takeaways:

  • Revenue fell 31% for US casinos, 79% in Macau, 33% for Europe land-based gaming
  • Nevada, the home of US gambling, saw 2020 gaming revenue plummet as restrictions took effect

According to the latest American Gaming Association data, total US commercial gaming revenue fell by 31% for the year, to $30bn. Meanwhile, Macau venues posted total revenue of $7.57bn, showing a staggering 79% year-on-year decline. Overall, the market was down $28.93bn, dwarfing US total losses.

Revenue data from various sources shows that land-based casino revenue loss in the US, Macau, and Europe combined exceeds 50 billion USD in 2020 compared to 2019.

Europe’s operators seemingly fared best out of the three markets, losing an estimated $10.6bn from 2019 levels. Still, EGBA projections for 2020 land-based gaming revenue indicate a considerable 33% year-on-year drop.

Vegas an indicator of US struggles

In Las Vegas, the impact of the March casino closures became evident as Nevada posted its worst full-year GGR since 1996. The Strip saw its worst full month in 27 years last December. Across the US, Pennsylvania gaming revenue fell 22% for 2020, while New Jersey posted a drop of 17%.

There is now hope for a casino market rebound as restrictions gradually lift. Betfred executive Stephen A. Crystal predicts Vegas’s return to growth in under two years, while MGM CEO Bill Hornbuckle anticipates a 90% recovery in resort business by 2022.

Cracks widen in Macau

Despite Macau casinos closing for just two weeks in February 2020, they struggled with border restrictions imposed by COVID-19. The region saw only 250,000 visitors in the month after casinos reopened, down 92% year-on-year. Visitor numbers have remained low.

Las Vegas Sands’ Macau GGR fell 81% in 2020 to $1.7bn, as MGM’s and Wynn Resorts’ Macau operations saw full-year declines of 78% and 89%. The gambling hub ended the year with its worst gaming revenue since 2010. JP Morgan analysts predict a return to 2019 gaming revenue levels in Q3 2021, while Morgan Stanley forecasts a return to growth in the full-year revenue of 2022.

UK lockdowns clip casino wings

UK Prime Minister Boris Johnson ordered the shuttering of casinos in March 2020, with facilities remaining closed for almost five months after the first lockdown. Constant delays to reopening proved expensive for operators across the country, forcing Genting UK to permanently close down casinos and all live poker rooms.

As the region remains under full lockdown conditions, the Betting and Gaming Council has urged the UK government not to exclude casinos from upcoming reopening plans.

Read the full analysis by Owain Flanders in the VegasSlotsOnline News section.

About Us:

The VegasSlotsOnline News section has become a respected source of gambling news since launching in 2018. With a primary focus on the US and UK markets, we publish daily updates from all corners of the industry, including gambling legislation, casino, poker, sports betting, and iGaming.

Infographic – https://mma.prnewswire.com/media/1442930/VegasSlotsOnline_2020_Infographic.jpg


Cision View original content to download multimedia:http://www.prnewswire.com/news-releases/vegasslotsonline-news-analysis-how-a-pandemic-affected-casino-markets-across-the-globe-301233581.html

SOURCE VegasSlotsOnline

SYNLawnⓇ Unveils New and Enhanced Artificial Turf Products for New Year

DALTON, Ga., Feb. 23, 2021 /PRNewswire/ – SYNLawn®, the largest manufacturer and unrivaled innovator of artificial grass in North America, announced its latest product enhancements and new offerings debuting in early 2021. Products now include more soy content, advanced drainage, additional color options and Super Yarn™…

DALTON, Ga., Feb. 23, 2021 /PRNewswire/ – SYNLawn®, the largest manufacturer and unrivaled innovator of artificial grass in North America, announced its latest product enhancements and new offerings debuting in early 2021. Products now include more soy content, advanced drainage, additional color options and Super Yarn™ technology. SYNLawn will soon have five new additions that have earned Certified Biobased Product labels from the U.S. Department of Agriculture (USDA).

«SYNLawn is committed to sustainability,» said George Neagle, executive vice president at SYNLawn. «We are uniquely positioned as the first synthetic turf company with a certified product through the USDA’s BioPreferred Program, as well as more currently in development, which increases the use of renewable agricultural resources and contributes to reducing negative environmental and health impacts.»

In an increasingly crowded marketplace, SYNLawn strives to provide exceptional quality and real value for its customers with standout products including unmatched lifetime warranties, commitment to sustainability and the industry’s leading safety ratings. The new offerings include:

  • SYNPro PET: The low pile turf is an ideal choice for pets and their parents. It’s easy to clean and maintain, plus offers a high drainage rate.
  • SYNPro PLAY: Multi-use turf for landscape, pets, playgrounds, sport and golf. Available in five fun stock colors and custom by request.
  • SYNLawn PLAY PLATINUM STX43 with Super Yarn: Designed for playgrounds as a safe turf for kids of all ages with non-abrasive grass blades. Includes Sanitized® Antimicrobial, DualChill™IR Reflective and StatBlock™Anti-Static.
  • SYNSport: This multi-purpose turf variety is perfect for golf fairways and sport applications both indoors and outdoors. It’s available with colors to allow for inclusion of sports features and boundaries.
  • SYNRye 200: Ideal for high foot traffic areas, ASTM Certified E108 Class A Fire-Rated with HeatBlock™ and UV protection.
  • SYNPro 80: A perfect fit for residential lawns and durable enough to meet the demands of commercial applications as well.
  • SYNPro 100: Premium quality for contractors and landscape, pets and play applications.
  • SYNTipede X43 with Super Yarn: Superior durability with an unexpected soft touch. Designed for high foot traffic applications, including schools, playgrounds, public parks and commercial uses. Includes Sanitized® Antimicrobial, DualChill™IR Reflective and StatBlock™Anti-Static.
  • SYNAugustine 847 with Super Yarn: The thickest, most dense artificial turf style available. The low pile-height, close-knit thatch, and realistic grass blades are perfect for pet parents, commercial pet facilities, and golfers. Includes Sanitized® Antimicrobial, DualChill™IR Reflective and StatBlock™Anti-Static.
  • SYNLawn ROOFDECK PLATINUM Platinum SR 200: The ultimate artificial roof, deck, and patio grass for performance and safety. Nylon fibers provide a high melt resistance against window reflectivity, and the highest-rated safety rating in the industry.

For more information about SYNLawn’s full range of products, visit www.SYNLawn.com.

ABOUT SYNLAWN

SYNLawn is the largest manufacturer and unrivaled innovator of artificial grass in North America. As part of the SportGroup Holding® family of companies, SYNLawn, along with sister surfacing brands – Astroturf, Rekortan, APT and Laykold – delivers the best products available on the market. SYNLawn’s product offerings also include Calico Greens™, an upscale line of artificial wall displays. SYNLawn’s turnkey network of 100 distributors seamlessly combines environmental stewardship with industry-leading innovations. Manufactured in Dalton, GA, SYNLawn uses bio-based ingredients, such as soy and sugarcane, and consumer-conscious additives such as antimicrobials to meet customers’ wide range of needs. With more than 200,000 residential and commercial installations, the company is raising the bar for global synthetic turf standards and transforming the idea of grass. We have a proprietary system that accounts for more than 70 percent renewable content. For more information visit www.SYNLawn.com and follow us on Facebook, Instagram, LinkedIn, Pinterest and YouTube.

Media Contact:
Mackenzie Smith
msmith@fwv-us.com  
574-524-5916

Cision View original content to download multimedia:http://www.prnewswire.com/news-releases/synlawn-unveils-new-and-enhanced-artificial-turf-products-for-new-year-301233321.html

SOURCE SYNLawn

Flock Freight Reaches Carbon Neutral with Shared Truckload Mode to Drive Sustainability in Freight Shipping Industry

SOLANA BEACH, Calif., Feb. 23, 2021 /PRNewswire/ — Flock Freight, the only logistics provider that offers a shared truckload shipping solution for businesses, today announced its partnership with <a target="_blank"…

SOLANA BEACH, Calif., Feb. 23, 2021 /PRNewswire/ — Flock Freight, the only logistics provider that offers a shared truckload shipping solution for businesses, today announced its partnership with Carbonfund.org Foundation to offset 100% of carbon emissions of its FlockDirect shipping mode in 2021 through carbon offsets at no extra cost to shippers.

Flock Freight’s shared truckload solution eliminates terminals and cuts freight-related carbon emissions by up to 40%. Flock Freight reduced 4,127 metric tons in carbon emissions in 2020 as a part of its pledge for sustainability as the first in the industry to become B Corporation certified. In 2021, Flock Freight is making an even stronger commitment to sustainability by reaching net neutrality with its shared truckload solution. All emissions produced by FlockDirect truck shipments will be accounted for in full and eliminated through the purchase of carbon offsets in partnership with Carbonfund.org with the goal of offsetting 20,000 metric tons in carbon emissions in 2021.

Flock Freight is changing the freight shipping model through its shared truckload solution, pooling less-than truckload shipments on one truck based on route optimization and last-in, first-out loading mentality. The result is high-quality truckload service for smaller loads. The carbon offsets purchased in 2021 will support the Truck Stop Electrification Project, which reduces truck idle time while providing truck drivers with an in-cab module to heat, cool, and power radio, etc. via an efficient external unit.

«It is our mission at Flock Freight to reduce waste and inefficiency in the freight shipping industry,» said Oren Zaslansky, founder and CEO of Flock Freight. «Taking our commitment to the next level allows us to make an industry-first move in establishing carbon-neutral shipping as the standard model for our shippers and carriers and prove that it not only can be done but should be done industry-wide.»

The Truck Stop Electrification Project will reduce tailpipe emissions from freight trucks that transport consumer goods all across the country by allowing long-haul truck drivers to heat or cool their cab and to power on-board appliances during the federally mandated rest period without idling truck engines. Engine idling creates poor resting conditions for the driver and fosters unhealthy conditions since a large number of trucks idle in close proximity. Idling also consumes fuel while moving no product, reduces engine life, and requires more frequent engine maintenance.

«We are excited to partner with Flock Freight in the effort to eliminate carbon emissions in the trucking industry, which is generally a big contributor to global carbon emissions,» said Eric M. Carlson, president of Carbonfund.org. «Making industry-leading steps like Flock Freight is doing will encourage new practices industry-wide in the future, which will enable a more sustainable future for humans and our planet.»

About Flock Freight
Flock Freight is a San Diego-based B Corp that’s been reinventing traditional shipping methods since opening for business in 2015. As the only digital freight provider to guarantee shared truckload shipping, Flock Freight leverages proprietary technology and relationship-driven service to pool shipments that are going the same direction onto one truck. The company provides faster, safer, and more sustainable service for LTL and TL shippers, in addition to increased revenue potential for carriers. Flock Freight’s shared truckload solution eliminates terminals and cuts freight-related carbon emissions by up to 40%. Flock Freight is backed by SignalFire, GLP, GV, and several other leaders in the supply chain transformation.

Cision View original content to download multimedia:http://www.prnewswire.com/news-releases/flock-freight-reaches-carbon-neutral-with-shared-truckload-mode-to-drive-sustainability-in-freight-shipping-industry-301231579.html

SOURCE Flock Freight

HomeAdvisor Breaks Down Cost in Relaunch of Annual True Cost Report

DENVER, Feb. 23, 2021 /PRNewswire/ — HomeAdvisor, a leading digital marketplace and operating business of ANGI Homeservices (NASDAQ: ANGI), has relaunched its annual <a target="_blank"…

DENVER, Feb. 23, 2021 /PRNewswire/ — HomeAdvisor, a leading digital marketplace and operating business of ANGI Homeservices (NASDAQ: ANGI), has relaunched its annual True Cost Report*, which looks into the complexities behind the cost of home projects. This report, compiled by HomeAdvisor’s Chief Economist, Mischa Fisher, looks at the distinct levers adjusting the cost of common home projects including how and why they have been impacting pricing at the consumer level. It also takes a deep dive into understanding the most important and most complex of cost factors: labor quality.

«There is a big information imbalance when it comes to home services and a lot of that centers around cost. Homeowners often lack a full understanding of what goes into pricing and commonly have a hard time answering the question, ‘is this a fair price for the work I want done,'» said Mischa Fisher, Chief Economist, HomeAdvisor. «We wanted to take a deep dive this year into this information imbalance and answer some of the fundamental questions about cost including looking at the top completed projects of 2020 their costs and how and why those costs have been changing. For the market to work at its best, it is important for homeowners to understand what different home services cost and to understand what drives those costs.»

«Home services is also a unique industry in that the consumer is directly exposed to the majority of the supply chain – they buy the materials, see the work done first-hand and often have labor itemized on their bills,» continued Fisher. «The more they understand what they don’t necessarily see – the hidden value of a high-quality pro – the more they’ll be open to cost adjustments to reflect the work done in the most important place to them – their homes.»

This report looks into the intangible value high-quality pros bring to their projects, such as honesty, transparency, artistry, environmental responsibility, accurate time and cost estimates, consideration of the homeowner’s lifestyle, consulting on design choices, consideration of materials for certain climates and more.

Additional insights include:

–  Lower costs do not necessarily mean increased popularity of projects. The top three completed projects in 2020 included interior painting (average cost $2,007), bathroom remodels (average cost $13,401) and new flooring (average cost $4,680).
–  From 2019 to 2020, additions, closets and cabinetry had the biggest rise in pricing, with project prices increasing by 30%, 33% and 56% respectively.
–  From 2019 to 2020, computer networking, smart home systems and above ground swimming pools all dropped the most in average price, falling 10%, 39% and 40% respectively.
–  For homeowners, there are four main factors essential to understanding cost: material quantity, material quality, labor quantity and labor quality.

This report also looked at how the COVID-19 pandemic impacted the cost and pricing of home services. Topline costs for most of the top 20 projects went up, with a few exceptions, and it was likely primarily due to an increase in the cost of materials.

«COVID-19 likely caused scarcity and factory shutdowns, as well as supply chain disruptions and greater consumer demand for home services,» said Fisher. «Despite this higher demand, home services are unique in that pros will opt to turn down jobs rather than raise prices. Instead of seeing prices rise due to shortages of labor, we’re seeing them due to scarcity of materials.»

To view the complete report, visit HomeAdvisor’s True Cost Report page.

About HomeAdvisor
HomeAdvisor® is a digital marketplace evolving the way homeowners connect with service professionals to complete home projects. With HomeAdvisor’s on-demand platform, homeowners can find and vet local, prescreened home service professionals; view average home project costs using True Cost Guide; and instantly book appointments online or through HomeAdvisor’s award-winning mobile app, which is compatible with all iOS, Android and virtual assistants, including Amazon Echo. HomeAdvisor is based in Denver, Colo., and is an operating business of ANGI Homeservices, Inc. (NASDAQ: ANGI). 

*Data included in the True Cost Report is based on internal HomeAdvisor marketplace data of median costs, and surveys conducted by HomeAdvisor’s internal research team of the general population. Project costs are calculated based on a rolling median of consumer reported pricing for jobs completed through HomeAdvisor. Spending priorities for the top projects in 2020 and the top planned projects in 2021 came from a survey of 1,400 US adults. The survey used post-sample weighting of multiple demographic attributes to develop a representative sample of the entire U.S. population. This is a groundbreaking level of detail on home spending that provides new insights into how people spend on their homes. The material and information contained in this report is for general information purposes only. You should not rely upon such information as a basis for making any business, legal or any other decisions.

Cision View original content:http://www.prnewswire.com/news-releases/homeadvisor-breaks-down-cost-in-relaunch-of-annual-true-cost-report-301232989.html

SOURCE HomeAdvisor

Wyndham Launches La Quinta Brand in the Middle East with New Hotel in Historic Area of Dubai

PARSIPPANY, N.J., Feb. 23, 2021 /PRNewswire/ — Wyndham Hotels & Resorts, the world’s largest hotel franchising company by number of properties with over 8,900 hotels across nearly 95 countries, today announced the debut of its La Quinta by Wyndham brand in the Middle…

PARSIPPANY, N.J., Feb. 23, 2021 /PRNewswire/ — Wyndham Hotels & Resorts, the world’s largest hotel franchising company by number of properties with over 8,900 hotels across nearly 95 countries, today announced the debut of its La Quinta by Wyndham brand in the Middle East with a new 100-room property in Dubai. Expected to open in March 2021, La Quinta by Wyndham Dubai Bur Dubai will be centrally located in the historic Bur Dubai district.  

Wyndham continues to expand the La Quinta brand – a leading upper-midscale brand with nearly 940 hotels offering contemporary design, thoughtful amenities and friendly service – throughout the world. This hotel marks the 75th La Quinta property to open since Wyndham acquired the brand in 2018.  La Quinta has now expanded to nine countries: Canada, Chile, Colombia, Honduras, Mexico, Turkey, New Zealand, the United Arab Emirates, and the United States. The brand has also announced plans to open eight new La Quinta hotels in the Dominican Republic.

The new Dubai property is located in one of the city’s bustling commercial hubs offering easy access to leisure attractions, including the Dubai Cruise Terminal at Port Rashid, The Dubai Mall, the Dubai Frame and Jumeirah Mosque, as well as business hotspots such as the Dubai World Trade Centre and the city’s financial district. The newly refurbished hotel will boast contemporary guest rooms and elegant interiors, combining Dubai’s traditional trading colors with a modern twist that replicates the city’s lively scene. La Quinta by Wyndham Dubai Bur Dubai will also offer a 100-square metre event and meeting space and a host of additional amenities, including an outdoor pool with pool deck, a spacious spa with sauna and steam room, and a modern fitness centre. Other features will include all-day dining, a lounge, coffee shop, 24/7 room service, and speciality restaurants serving Indian delicacies and international menus. A 24-hour business centre, children’s play area and pool, dedicated retail space, ample parking, and a local shuttle add to the hotel’s positioning as ideal for business or leisure.

Dimitris Manikis, President Europe, Middle East, Eurasia and Africa (EMEA), Wyndham Hotels & Resorts, said: «We are on a strong growth trajectory for La Quinta by Wyndham, and this latest addition further highlights our commitment to expand the brand in EMEA and around the world. Dubai is one of the most sought out destinations for travelers from all corners of the globe, making it the ideal location to launch La Quinta in the market. This property perfectly complements our portfolio of over 60 hotels in the Middle East and Africa and we look forward continuing to grow our robust pipeline in the region.»

Wyndham hotels in the Middle East and around the world participate in Wyndham Rewards®, the world’s most generous hotel rewards programme with more than 30,000 hotels, vacation club resorts and vacation rentals worldwide.

About La Quinta by Wyndham 
With nearly 940 destinations globally, the La Quinta by Wyndham brand is a bright spot in every traveller’s journey. The brand offers thoughtful amenities, friendly service, and consistently delivers an exceptional guest experience that keeps travelers waking up on the bright side. For more information, visit www.lq.com. Like and follow LQ on Facebook and YouTube. If you are interested in developing a hotel, please visit https://whrdevelopmentemea.com/.

About Wyndham Hotels & Resorts
Wyndham Hotels & Resorts (NYSE: WH) is the world’s largest hotel franchising company by the number of properties, with over 8,900 hotels across nearly 95 countries on six continents. Through its network of approximately 796,000 rooms appealing to the everyday traveler, Wyndham commands a leading presence in the economy and midscale segments of the lodging industry. The Company operates a portfolio of 20 hotel brands, including Super 8®, Days Inn®, Ramada®, Microtel®, La Quinta®, Baymont®, Wingate®, AmericInn®, Hawthorn Suites®, Trademark Collection® and Wyndham®. Wyndham Hotels & Resorts is also a leading provider of hotel management services. The Company’s award-winning Wyndham Rewards loyalty program offers 86 million enrolled members the opportunity to redeem points at thousands of hotels, vacation club resorts and vacation rentals globally.  For more information, visit www.wyndhamhotels.com.

Contacts
Silvia de Candia
Wyndham Hotels & Resorts
+44 796 63 88 208
silvia.decandia@wyndham.com

Scott Carman
Wyndham Hotels & Resorts
+1 (973) 753-6590
scott.carman@wyndham.com

Cision View original content to download multimedia:http://www.prnewswire.com/news-releases/wyndham-launches-la-quinta-brand-in-the-middle-east-with-new-hotel-in-historic-area-of-dubai-301233491.html

SOURCE Wyndham Hotels & Resorts

TrueCar Forecasts New Vehicle Retail Sales Flat, Used Retail Sales Down for February 2021

SANTA MONICA, Calif., Feb. 23, 2021 /PRNewswire/ — TrueCar, Inc., the most efficient and transparent way to find a car, projects total new vehicle sales will reach 1,170,856 units in February 2021, down 7.6% from a year ago when adjusted for the same number of selling days. This month’s seasonally adjusted annualized rate…

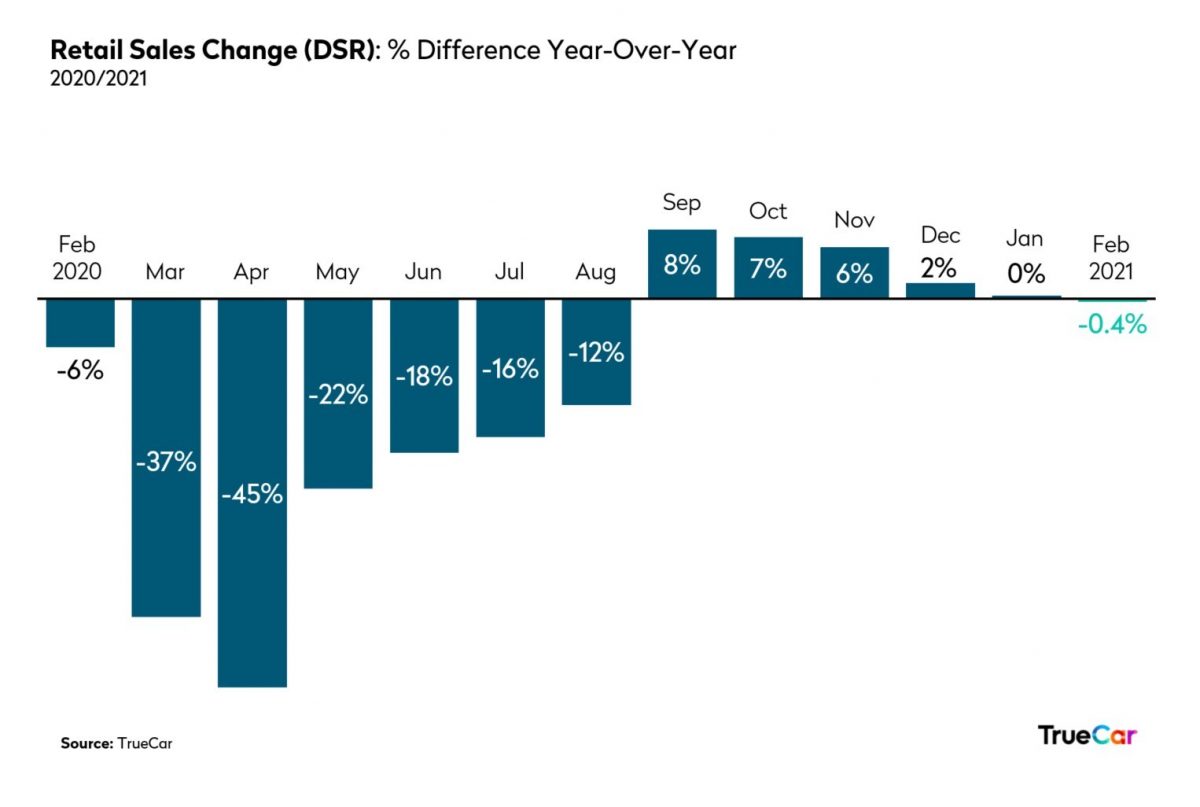
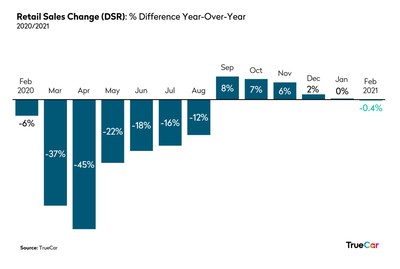
SANTA MONICA, Calif., Feb. 23, 2021 /PRNewswire/ — TrueCar, Inc., the most efficient and transparent way to find a car, projects total new vehicle sales will reach 1,170,856 units in February 2021, down 7.6% from a year ago when adjusted for the same number of selling days. This month’s seasonally adjusted annualized rate (SAAR) for total light vehicle sales is an estimated 15.5 million units. Excluding fleet sales, TrueCar expects U.S. retail deliveries of new cars and light trucks to be 967,545 units, a decrease of 0.4% from a year ago when adjusted for the same number of selling days. Used vehicle sales for February 2021 are expected to reach 3.5 million, down 4% from a year ago and up 12% from January 2021. 
«New vehicle retail sales are expected to be flat for February, which is a good result given the expansive and prolonged nature of the winter storms throughout many parts of the country, including southern states, which do not typically experience snow storms of this caliber. At this time, many people are thinking about basic necessities, not purchasing their next vehicle. Those consumers are likely deferring their vehicle purchasing to the end of the month or to March,» said Nick Woolard, Lead Industry Analyst at TrueCar.

«We’re seeing fleet recovery slow down significantly year-over-year. February is typically a big month for fleet sales, but the continued reduction in travel by consumer is delaying fleet recovery.  This may be a sign that manufacturers are beginning to triage the ongoing microchip shortage by further pulling back from fleet and reallocating towards retail to help limit inventory shortages,» added Woolard.

«It’s important to call out GM and Toyota, which are both up year-over-year in retail sales as a result of their strong and diversified lineups with in-demand SUVs and trucks. Toyota has doubled down on their hybrid strategy with the RAV4, Highlander, Sienna, and Venza, while GM continues to successfully produce a variety of popular trucks,» said Valeri Tompkins, Senior Vice President, OEM Solutions at TrueCar.  

Average transaction prices (ATP) are projected to be up 6.6% or $2,366 from a year ago and up 1.4% or $518 from January 2021. TrueCar projects that U.S. revenue from new vehicle sales will reach approximately $44 billion for February 2021, down 9.1% (based on a non-adjusted daily selling rate) from a year ago and up 7% from last month.

«As average transaction price continues to increase and inch closer towards the $40,000 mark, incentives continue to trend downward. Based on TrueCar data, incentives are the lowest that we have seen since at least 2017. With inventory still recovering from pandemic related production pauses and the chip shortage threatening to disrupt production again, incentives will stay low until the recovery is met,» added Tompkins.  

Additional Insights (forecast by TrueCar):

  • Total retail sales for February 2021 are expected to be down 0.4% from a year ago and down 1.9% from January 2021 when adjusted for the same number of selling days.
  • Fleet sales for February 2021 are expected to be down 31% from a year ago and up 65% from January 2021 when adjusted for the same number of selling days.
  • Average transaction price is projected to be up 6.6% or $2,366 from a year ago and up 4.5% or $518 from January 2021.
  • Total SAAR is expected to decrease 7.4% from a year ago from 16.7 million units to 15.5 million units.
  • Used vehicle sales for February 2021 are expected to reach 3.5 million, down 12% from a year ago and up 12% from January 2021.
  • The average interest rate on new vehicles is 4.4% and the average interest rate on used vehicles is 8.0%.

February 2021 forecasts for the 13 largest manufacturers by volume. For additional data, visit the TrueCar Newsroom.

Total Unit Sales

Manufacturer

Feb 2021 Forecast

Feb 2020 Actual

Jan 2021 Actual

YoY % Change

YoY % Change (Daily Selling Rate)

MoM % Change

MoM % Change (Daily Selling Rate)

BMW

23,839

27,476

19,740

-13.2%

-6.0%

20.8%

20.8%

Daimler

17,416

26,088

25,268

-33.2%

-27.7%

-31.1%

-31.1%

Ford

158,869

189,561

142,577

-16.2%

-9.2%

11.4%

11.4%

GM

214,265

238,448

201,954

-10.1%

-2.7%

6.1%

6.1%

Honda

100,884

120,006

92,225

-15.9%

-8.9%

9.4%

9.4%

Hyundai

42,436

54,600

46,208

-22.3%

-15.8%

-8.2%

-8.2%

Kia

44,569

52,177

44,965

-14.6%

-7.5%

-0.9%

-0.9%

Nissan

86,810

99,253

71,081

-12.5%

-5.2%

22.1%

22.1%

Stellantis

142,459

183,926

134,406

-22.5%

-16.1%

6.0%

6.0%

Subaru

46,158

51,695

46,400

-10.7%

-3.3%

-0.5%

-0.5%

Tesla

21,981

20,450

24,700

7.5%

16.4%

-11.0%

-11.0%

Toyota

177,461

195,407

167,936

-9.2%

-1.6%

5.7%

5.7%

Volkswagen Group

44,351

50,390

44,953

-12.0%

-4.7%

-1.3%

-1.3%

Industry

1,170,856

1,373,324

1,109,578

-14.7%

-7.6%

5.5%

5.5%

Retail Unit Sales

Manufacturer

Feb 2021 Forecast

Feb 2020 Actual

Jan 2021 Actual

YoY % Change

YoY % Change (Daily Selling Rate)

MoM % Change

MoM % Change (Daily Selling Rate)

BMW

22,861

24,271

19,407

-5.8%

2.0%

17.8%

17.8%

Daimler

17,101

24,513

24,751

-30.2%

-24.4%

-30.9%

-30.9%

Ford

111,916

120,607

116,069

-7.2%

0.5%

-3.6%

-3.6%

GM

164,432

169,235

175,007

-2.8%

5.3%

-6.0%

-6.0%

Honda

100,282

118,802

91,837

-15.6%

-8.6%

9.2%

9.2%

Hyundai

39,248

42,863

43,554

-8.4%

-0.8%

-9.9%

-9.9%

Kia

41,225

45,983

43,292

-10.3%

-2.9%

-4.8%

-4.8%

Nissan

58,715

68,093

58,548

-13.8%

-6.6%

0.3%

0.3%

Stellantis

112,778

117,974

111,096

-4.4%

3.6%

1.5%

1.5%

Subaru

43,604

48,655

44,670

-10.4%

-2.9%

-2.4%

-2.4%

Tesla

21,969

20,450

24,692

7.4%

16.4%

-11.0%

-11.0%

Toyota

155,138

160,981

148,143

-3.6%

4.4%

4.7%

4.7%

Volkswagen Group

42,855

45,272

44,298

-5.3%

2.5%

-3.3%

-3.3%

Industry

967,545

1,052,254

986,522

-8.1%

-0.4%

-1.9%

-1.9%

Fleet Unit Sales

Manufacturer

Feb 2021 Forecast

Feb 2020 Actual

Jan 2021 Actual

YoY % Change

YoY % Change
(Daily Selling Rate)

MoM % Change

MoM % Change (Daily Selling Rate)

BMW

978

3,205

333

-69.5%

-67.0%

193.8%

193.8%

Daimler

315

1,575

517

-80.0%

-78.3%

-39.0%

-39.0%

Ford

46,953

68,954

26,508

-31.9%

-26.2%

77.1%

77.1%

GM

49,833

69,213

26,947

-28.0%

-22.0%

84.9%

84.9%

Honda

602

1,204

388

-50.0%

-45.8%

55.2%

55.2%

Hyundai

3,187

11,737

2,654

-72.8%

-70.6%

20.1%

20.1%

Kia

3,345

6,194

1,673

-46.0%

-41.5%

100.0%

100.0%

Nissan

28,094

31,160

12,533

-9.8%

-2.3%

124.2%

124.2%

Stellantis

29,681

65,952

23,310

-55.0%

-51.2%

27.3%

27.3%

Subaru

2,554

3,040

1,730

-16.0%

-9.0%

47.6%

47.6%

Tesla

12

8

42.5%

42.5%

Toyota

22,323

34,426

19,793

-35.2%

-29.8%

12.8%

12.8%

Volkswagen Group

1,495

5,118

655

-70.8%

-68.3%

128.2%

128.2%

Industry

203,311

321,070

123,056

-36.7%

-31.4%

65.2%

65.2%

Fleet Penetration

Manufacturer

Feb 2021 Forecast

Feb 2020 Actual

Jan 2021 Actual

YoY % Change

MoM % Change

BMW

4.1%

11.7%

1.7%

-64.8%

143.3%

Daimler

1.8%

6.0%

2.0%

-70.0%

-11.6%

Ford

29.6%

36.4%

18.6%

-18.8%

59.0%

GM

23.3%

29.0%

13.3%

-19.9%

74.3%

Honda

0.6%

1.0%

0.4%

-40.5%

41.8%

Hyundai

7.5%

21.5%

5.7%

-65.1%

30.8%

Kia

7.5%

11.9%

3.7%

-36.8%

101.7%

Nissan

32.4%

31.4%

17.6%

3.1%

83.5%

Stellantis

20.8%

35.9%

17.3%

-41.9%

20.1%

Subaru

5.5%

5.9%

3.7%

-5.9%

48.4%

Tesla

0.1%

0.0%

0.0%

60.1%

Toyota

12.6%

17.6%

11.8%

-28.6%

6.7%

Volkswagen Group

3.4%

10.2%

1.5%

-66.8%

131.4%

Industry

17.4%

23.4%

11.1%

-25.7%

56.6%

Total Market Share

Manufacturer

Feb 2021 Forecast

Feb 2020 Actual

Jan 2021 Actual

BMW

2.0%

2.0%

1.8%

Daimler

1.5%

1.9%

2.3%

Ford

13.6%

13.8%

12.8%

GM

18.3%

17.4%

18.2%

Honda

8.6%

8.7%

8.3%

Hyundai

3.6%

4.0%

4.2%

Kia

3.8%

3.8%

4.1%

Nissan

7.4%

7.2%

6.4%

Stellantis

12.2%

13.4%

12.1%

Subaru

3.9%

3.8%

4.2%

Tesla

1.9%

1.5%

2.2%

Toyota

15.2%

14.2%

15.1%

Volkswagen Group

3.8%

3.7%

4.1%

Retail Market Share

Manufacturer

Feb 2021 Forecast

Feb 2020 Actual

Jan 2021 Actual

BMW

2.4%

2.3%

2.0%

Daimler

1.8%

2.3%

2.5%

Ford

11.6%

11.5%

11.8%

GM

17.0%

16.1%

17.7%

Honda

10.4%

11.3%

9.3%

Hyundai

4.1%

4.1%

4.4%

Kia

4.3%

4.4%

4.4%

Nissan

6.1%

6.5%

5.9%

Stellantis

11.7%

11.2%

11.3%

Subaru

4.5%

4.6%

4.5%

Tesla

2.3%

1.9%

2.5%

Toyota

16.0%

15.3%

15.0%

Volkswagen Group

4.4%

4.3%

4.5%

Average Transaction Price (ATP)

Manufacturer

Feb 2021 Forecast

Feb 2020 Actual

Jan 2021 Actual

YOY

MOM

BMW

$59,919

$57,587

$57,922

4.0%

3.4%

Daimler

$62,806

$61,188

$62,387

2.6%

0.7%

Ford

$44,925

$42,465

$43,535

5.8%

3.2%

GM

$42,797

$39,979

$42,045

7.0%

1.8%

Honda

$31,166

$29,398

$31,059

6.0%

0.3%

Hyundai

$31,037

$29,279

$31,073

6.0%

-0.1%

Kia

$28,796

$25,988

$28,233

10.8%

2.0%

Nissan

$30,087

$28,470

$29,304

5.7%

2.7%

Stellantis

$43,903

$40,100

$42,713

9.5%

2.8%

Subaru

$30,701

$30,007

$30,616

2.3%

0.3%

Toyota

$35,135

$33,429

$34,890

5.1%

0.7%

Volkswagen Group

$43,870

$40,286

$43,358

8.9%

1.2%

Industry

$38,075

$35,709

$37,558

6.6%

1.4%

Incentive Spending

Manufacturer

Feb 2021 Forecast

Feb 2020 Actual

Jan 2021 Actual

YOY

MOM

BMW

$4,497

$5,821

$5,177

-22.8%

-13.1%

Daimler

$3,740

$6,246

$4,438

-40.1%

-15.7%

Ford

$3,472

$4,918

$4,441

-29.4%

-21.8%

GM

$4,710

$5,688

$4,944

-17.2%

-4.7%

Honda

$2,290

$2,559

$2,363

-10.5%

-3.1%

Hyundai

$2,205

$3,078

$2,558

-28.4%

-13.8%

Kia

$2,825

$3,686

$2,999

-23.4%

-5.8%

Nissan

$3,543

$4,749

$4,510

-25.4%

-21.4%

Stellantis

$4,186

$5,093

$4,642

-17.8%

-9.8%

Subaru

$1,401

$1,244

$1,505

12.6%

-6.9%

Toyota

$2,363

$2,649

$2,616

-10.8%

-9.7%

Volkswagen Group

$3,113

$4,435

$4,153

-29.8%

-25.1%

Industry

$3,356

$4,177

$3,787

-19.7%

-11.4%

Incentives as a Percentage of Average Transaction Price (ATP)

Manufacturer

Feb 2021 Forecast

Feb 2020 Actual

Jan 2021 Actual

YOY

MOM

BMW

7.5%

10.1%

8.9%

-25.8%

-16.0%

Daimler

6.0%

10.2%

7.1%

-41.7%

-16.3%

Ford

7.7%

11.6%

10.2%

-33.3%

-24.3%

GM

11.0%

14.2%

11.8%

-22.6%

-6.4%

Honda

7.3%

8.7%

7.6%

-15.6%

-3.4%

Hyundai

7.1%

10.5%

8.2%

-32.4%

-13.7%

Kia

9.8%

14.2%

10.6%

-30.8%

-7.6%

Nissan

11.8%

16.7%

15.4%

-29.4%

-23.5%

Stellantis

9.5%

12.7%

10.9%

-24.9%

-12.3%

Subaru

4.6%

4.1%

4.9%

10.0%

-7.2%

Toyota

6.7%

7.9%

7.5%

-15.1%

-10.3%

Volkswagen Group

7.1%

11.0%

9.6%

-35.5%

-25.9%

Industry

8.8%

11.7%

10.1%

-24.6%

-12.6%

(Note: This forecast is based solely on TrueCar, Inc.’s analysis of industry sales trends and conditions and is not a projection of TrueCar, Inc.’s operations.)

About TrueCar

TrueCar is a leading automotive digital marketplace that enables car buyers to connect to our nationwide network of Certified Dealers. We are building the industry’s most personalized and efficient car buying experience as we seek to bring more of the purchasing process online. Consumers who visit our marketplace will find a suite of vehicle discovery tools, price ratings, and market context on new and used cars – all with a clear view of what’s a great deal. When they are ready, TrueCar will enable them to connect with a local Certified Dealer who shares in our belief that truth, transparency, and fairness are the foundation of a great car buying experience. As part of our marketplace, TrueCar powers car-buying programs for over 250 leading brands, including AARP, Sam’s Club, and American Express. Nearly half of all new-car buyers engage with TrueCar powered sites, where they buy smarter and drive happier. TrueCar is headquartered in Santa Monica, California, with offices in Austin, Texas, and Boston, Massachusetts.

For more information, please visit www.truecar.com, and follow us on Facebook or Twitter. TrueCar media line: +1-844-469-8442 (US toll-free) | Email: pr@truecar.com 

TrueCar PR Contacts:
Shadee Malekafzali
shadee@truecar.com 
424.258.8694

Tanya Kohan
tkohan@truecar.com 
714.425.6319


Cision View original content to download multimedia:http://www.prnewswire.com/news-releases/truecar-forecasts-new-vehicle-retail-sales-flat-used-retail-sales-down-for-february-2021-301233522.html

SOURCE TrueCar, Inc.
US Sports Camps Announces the Launch of their 2021 NIKE Football Camps

SAN RAFAEL, Calif., Feb. 23, 2021 /PRNewswire-PRWeb/ — NIKE Football Camps offer three different categories of camps to choose from across the U.S. – NIKE Contact Football Camps, <a target="_blank"…

SAN RAFAEL, Calif., Feb. 23, 2021 /PRNewswire-PRWeb/ — NIKE Football Camps offer three different categories of camps to choose from across the U.S. – NIKE Contact Football Camps, NIKE Flag Football Camps, and NIKE Skills Football Camps. These three styles of football camp allow athletes of every level and age the opportunity to work on both sides of the ball – learning and honing their defensive and offensive skills while choosing a program that fits their desires and goals.

«We are excited to be able to bring the NIKE Football Camps to young athletes across the country this summer,» says Michael de Surville, Senior VP and National Director at US Sports Camps. «It is our hope to provide quality football instruction in a fun and competitive setting while creating lasting memories and greater passion for the sport. Led by an experienced staff of College and High School coaches, campers will gain a greater understanding of the game, refinement of their skills, and have fun and learn valuable lessons on topics like sportsmanship and nutrition.»

Nike Contact Football Camps offer both youth and high school football camps featuring position specific drills and scrimmages with a staff of college coaches and current and former college players. Nike Flag Football Camps focus on position specific training for youth football players in a fun, controlled, and safe training environment. Concussion safety is addressed and applied during all instruction and games with an emphasis on sportsmanship and healthy competition. NIKE Skills Football Camps are non-contact skills training programs as well as position specific camps for quarterbacks, wide receivers, defensive backs, and linemen, along with general skills training.

Camp offerings are for players of all abilities, ages 6-18, and vary from Overnight, Day and Half programs. NIKE Flag Football Camps for Girls will also be offered at most locations across the country.

Players, Coaches, Parents and others interested in these camps can visit NIKE Football camps or call (800) 645-3226.

About US Sports Camps

US Sports Camps (USSC), headquartered in San Rafael, California, is America’s largest sports camp network and the licensed operator of Nike Sports Camps. The company has offered summer camps since 1975 with the same mission that defines it today: to shape a lifelong enjoyment of athletics through high quality sports education and skill enhancement.

Media Contact

Mike de Surville, US Sports Camps Inc., 1-800-645-3226, mdesurville@ussportscamps.com

Twitter


SOURCE US Sports Camps Inc.

Mazda Dealership Offers Advice for Texans on Driving in Snow

MESQUITE, Texas, Feb. 23, 2021 /PRNewswire-PRWeb/ — Currently, Texas is experiencing snowfall that hasn’t been seen for many years. While some counties see some snow every year, this is the first time all 254 counties have seen snow in 126 years. For many Texans, this is the first time that they are experiencing snow. However, this means that driving in snow is a foreign experience. Metro Mazda of Mesquite encourages its customers to…

MESQUITE, Texas, Feb. 23, 2021 /PRNewswire-PRWeb/ — Currently, Texas is experiencing snowfall that hasn’t been seen for many years. While some counties see some snow every year, this is the first time all 254 counties have seen snow in 126 years. For many Texans, this is the first time that they are experiencing snow. However, this means that driving in snow is a foreign experience. Metro Mazda of Mesquite encourages its customers to check out their blog about driving in snow.

This blog piece provides tips for safely navigating the snow covered roads across the state. These tips include driving slowly, how to regain control and navigating with different drivetrains. While there are many rules to follow when driving in snow, the Metro Mazda of Mesquite team wanted to focus on the tips that are most helpful for drivers who have never experienced snow.

If any customers in the Mesquite, Texas, area have experienced any collisions due to snow, they can visit the Metro Mazda of Mesquite service center for repairs. Although the dealership specializes in Mazda models, the technicians are trained to service any make or model. Car owners can also visit the parts store to make driving in the snow easier.

For more information, drivers can visit metromazdamesquite.com. Any questions about services or the blog can be answered by calling 833-320-1240. Metro Mazda of Mesquite is open Monday through Saturday from 9 a.m. to 7 p.m. The dealership is located at 15900 Lyndon B Johnson Freeway in Mesquite.

Media Contact

Emily Tedesco, Metro Mazda of Mesquite, 972-686-6200, etedesco@metromazdamesquite.com


SOURCE Metro Mazda of Mesquite

Fontana Car Dealership Offers New Mazda Digital Service

FONTANA, Calif., Feb. 23, 2021 /PRNewswire-PRWeb/ — The COVID-19 virus has changed how many businesses provide services. Businesses started to offer delivery, online shopping and many other convenient services. Fontana Mazda recently added a new convenient service to its website. The <a target="_blank"…

FONTANA, Calif., Feb. 23, 2021 /PRNewswire-PRWeb/ — The COVID-19 virus has changed how many businesses provide services. Businesses started to offer delivery, online shopping and many other convenient services. Fontana Mazda recently added a new convenient service to its website. The Mazda Digital Service allows customers to make servicing their vehicle much easier by having everything available through their smartphone.

Mazda drivers can now book appointments, make payments and stay informed on service appointments. When a customer brings their vehicle into the Fontana Mazda service center, a Mazda Service Professional will send a walkaround video of a multipoint inspection. This allows the vehicle owner to see which parts need to be replaced or fixed. These videos can be sent to the customer through email or text for future reference.

This digital service also comes with status updates so that clients know when their Mazda model is ready to be picked up from the service center. Payment for services can also be made ahead of time through mobile payments. Customers will be able to see how much a service will cost before the appointment to help save time. Service appointments can also be scheduled online through this service.

If any interested vehicle owners would like to learn more about this service, they can find more information at fontanamazda.com. Questions can be directed to the service team by calling 833-805-2735. The Fontana Mazda service center is open Monday through Friday from 7 a.m. to 5 p.m. and on Saturday from 7 a.m. to 3 p.m. Clients can find the dealership at 16800 S. Highland Ave. in Fontana.

Media Contact

Shawn Wade, Fontana Mazda, 909-550-5100, swade@fontanamazda.com


SOURCE Fontana Mazda