Omni Oklahoma City Hotel Proudly Opens Its Doors To The Oklahoma City Community

OKLAHOMA CITY, Jan. 26, 2021 /PRNewswire/ — Today, Omni Hotels & Resorts celebrates the grand opening of the highly anticipated <a target="_blank"…

OKLAHOMA CITY, Jan. 26, 2021 /PRNewswire/ — Today, Omni Hotels & Resorts celebrates the grand opening of the highly anticipated Omni Oklahoma City Hotel, a 605-guest room convention center hotel in the heart of Oklahoma City.

Images and videos of the hotel and ceremonious ribbon cutting can be found HERE.

Executives from Omni held a ribbon cutting alongside Oklahoma City Convention and Visitors Bureau Interim Director Mike Burns, The Honorable Oklahoma City Mayor David Holt, The Honorable Lt. Gov. Matt Pinnell, The Alliance for Economic Development of Oklahoma City President and CEO Cathy O’Connor and Greater Oklahoma City Chamber President and CEO Roy Williams. The 17-story hotel located at 100 West Oklahoma City Blvd. will serve the city’s revitalized downtown area including the convention center, Scissortail Park and Chesapeake Energy Arena, home of the NBA’s Oklahoma City Thunder.

«Those who walk through our doors, whether you’re traveling to Oklahoma City or you are a local enjoying a staycation or a day downtown, will feel an immediate sense of the deep authenticity and rich culture that this city has to offer,» Omni Oklahoma City General Manager Steve Keenan said. «Omni will offer a new and elegant way to experience an Oklahoma City adventure as we continuously aim to go the extra mile with every interaction and every gesture.»

Omni Oklahoma City Hotel marks the brand’s expansion into Oklahoma. The property consists of 78,000 square feet of flexible meeting, event and pre-function space and sits caddy-corner to a streetcar stop, placing the hotel right within the bustling community of downtown.

«Omni Hotels & Resorts is laser-focused on its development strategy and, despite the industry impacts of COVID-19, our expansion across the Red River reinforces our commitment to that strategy,» said Peter Strebel, president of Omni Hotels & Resorts. «We look forward to extending our genuine hospitality into this tenacious city and becoming a new addition to the downtown skyline that Oklahomans can be proud of. Each of our hotels are unique to the community, and Omni Oklahoma City Hotel is no different with a top-to-bottom design that authentically conveys the welcoming spirit of the city.»

The hotel’s design features elements that draw inspiration from the surrounding pastoral landscape of the Oklahoman terrain including layers of the earth and sky. Paying homage to the state and weaving in rustic, earthy tones that represent the prairie land and sunset, the property’s common areas, guest rooms, ballrooms and spa also embrace textured walls and components of wood, metal and chevron patterns that pay homage to the local industry; Oklahoma’s state bird, the Scissor-tailed flycatcher; and the economy of the city and its surroundings.

The hotel features 605 guest rooms, including 29 suites, with well-appointed furnishings, regional influences and dramatic views of Scissortail Park and the downtown skyline. Additionally, the hotel’s top 17th floor was designed to cater specifically to professional basketball players featuring California King beds, larger door frames and taller ceilings and shower heads.

Hotel amenities are available to locals, travelers and overnight guests. Hotel highlights include:

Food & Beverage: Omni Oklahoma City Hotel provides a variety of food and beverage outlets to anyone who walks through its doors. A perfect, culinary-forward experience for any occasion, the seven restaurant and bar outlets include Basin Bar, OKC Tap House, Bob’s Steak & Chop House and Park Grounds — which open with the hotel on Jan. 26 — in addition to Seltzer’s, Catbird Seat and Double Double Burger Bar, which will open at a later date.

Wellness: The full-service Mokara Spa, state-of-the-art fitness center and rooftop pool deck terrace will offer a premier and luxurious experience with personalized, exceptional service to all. Mokara Spa provides a tranquil relaxation lounge and features head-to-toe treatments, a revitalizing sauna and pampering nail services. Its design pulls inspiration from the state’s important commodity – cotton. The 24-hour fitness center is available to all guests and, located on the third floor, while the pool deck overlooks Scissortail Park providing beautiful, scenic views.

Meetings: Situated between the new convention center and Chesapeake Energy Arena, Omni Oklahoma City Hotel will be a nationwide destination for meetings and events. All 78,000 square feet of meeting space will be located on the second floor, with the exception of an outdoor event lawn on the third floor and a boardroom located on the 17th floor which can be used as a convenient and private meeting space for visiting NBA teams.

In the spirit of highlighting Oklahoma’s healthcare workers, Omni Oklahoma City Hotel is honored to recognize Charles Maines RN from INTEGRIS Southwest Hospital (INTEGRIS) as its first guest. Maines contracted COVID-19 earlier in 2020, successfully recovered and returned to work to continue treating patients battling COVID-19. As an inspiring leader to his team at INTEGRIS, Maines will also be enrolled as a lifetime member to Omni’s Select Guest ® Loyalty Program.

To add to the celebration, the office of Oklahoma City Mayor Holt proclaimed Tuesday, Jan. 26, 2021, as «Omni Oklahoma City Hotel Day.» The proclamation was read by Mayor Holt at the privately-held ribbon cutting event.

«The opening of the Omni in Oklahoma City is a continuation of an exciting chapter in downtown Oklahoma City’s ongoing transformation,» Mayor Holt said. «In partnership with the MAPS 3 convention center, Omni helps further propel our city to bring in new visitors, tax dollars and more.»

Omni Oklahoma City Hotel opens following Omni Hotels & Resorts’ Safe & Clean program. The initiative includes extensive cleaning guidelines, processes and procedures to ensure the health, safety and comfort of guests and associates. It is informed by the Centers for Disease Control and Prevention (CDC) guidelines and also meets the «Safe Stay» initiative set forth by the American Hotel & Lodging Association (AHLA).

The hotel is conveniently located in the heart of Oklahoma City with easy access to I-40 and the Will Rogers Airport. To book a stay, spa treatment, group meeting or event, visit omnihotels.com/hotels/oklahoma-city.

About Omni Hotels & Resorts
Omni Hotels & Resorts creates genuine, authentic guest experiences at 60 distinct luxury hotels and resorts in leading business and leisure destinations across North America. With more than 25 iconic golf courses and 16 award-winning spas featured in dynamic locales nationwide, every Omni proudly opens its doors to share the true spirit of its destination. Reflected through local color, personalized service, unique wellness options, signature restaurants and creative culinary offerings, Omni leaves a lasting impression with every guest and a heightened level of recognition and rewards delivered through its Select Guest® loyalty program. As a founding member of the Global Hotel Alliance, Select Guest is further expanded through the DISCOVERY loyalty program offering members additional global benefits. Omni is committed to reducing hunger and is on a mission through its Say Goodnight to Hunger initiative to provide millions of meals each year for food banks to feed children, families and seniors in communities in which it operates. Through its partnership with Shared Hope International, Omni is dedicated to the education and training of its associates to help combat human trafficking.

Omni Hotels & Resorts is the official hotel of the PGA TOUR® and PGA TOUR Champions. For information or to book accommodations, visit omnihotels.com or call 1-800-The-Omni.

Media Contact

Omni Contact:

Taylor Ketchum

Melissa Becker

(405) 834-2537

(972) 871-5556

Taylor@jones.pr

melissa.becker@omnihotels.com  

Cision View original content to download multimedia:http://www.prnewswire.com/news-releases/omni-oklahoma-city-hotel-proudly-opens-its-doors-to-the-oklahoma-city-community-301215141.html

SOURCE Omni Hotels & Resorts

TrueCar Forecasts New and Used Retail Sales Up Slightly Year-Over-Year for January 2021, While Fleet Recovery Drags

SANTA MONICA, Calif., Jan. 26, 2021 /PRNewswire/ — TrueCar, Inc. projects total new vehicle sales will reach 1,048,975 units in January 2021, down 4.4% from a year ago when adjusted for the same number of selling days. This month’s seasonally adjusted annualized rate (SAAR) for total light vehicle sales is an estimated 15.9…

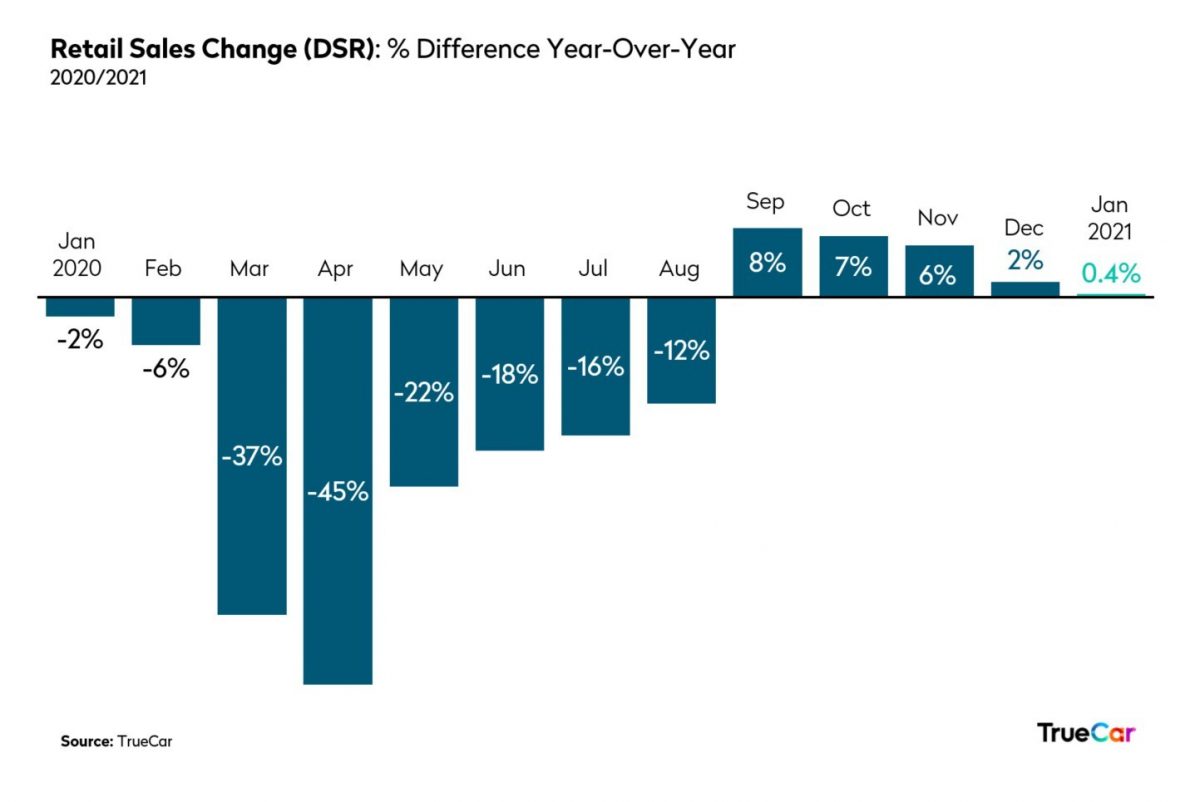
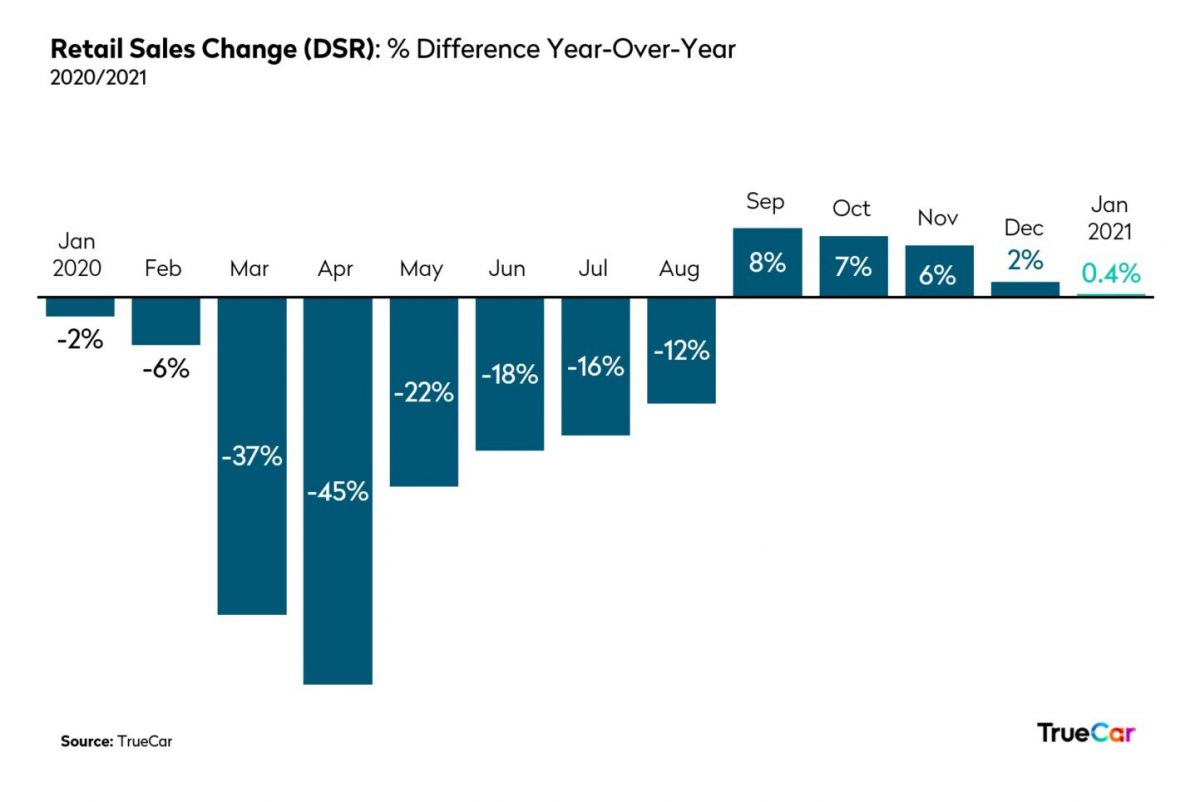
SANTA MONICA, Calif., Jan. 26, 2021 /PRNewswire/ — TrueCar, Inc. projects total new vehicle sales will reach 1,048,975 units in January 2021, down 4.4% from a year ago when adjusted for the same number of selling days. This month’s seasonally adjusted annualized rate (SAAR) for total light vehicle sales is an estimated 15.9 million units. Excluding fleet sales, TrueCar expects U.S. retail deliveries of new cars and light trucks to be 880,552 units, an increase of 0.4% from a year ago when adjusted for the same number of selling days. Used vehicle sales for January 2021 are expected to reach 3.2 million, up 1% from a year ago and up 10% from December 2020. 

«Entering 2021 with retail sales in line with last year is a big win for the automotive industry,» said Nick Woolard, Lead Industry Analyst at TrueCar. «However, while retail sales have rebounded, rental fleets remained depressed and continue to interrupt fleet sales. . As a result, fleet sales are struggling to come back to pre-pandemic levels and are driving total unit sales down.»

«The automotive industry continues to reap the benefits of continued strength in retail demand with lower incentive spend. A handful of brands such as Ford, Genesis, GMC, Ram and Toyota, appear to be in the coveted quadrant of both retail growth as well as incentive decline. This is mostly driven by new product and being in the right segments or a combination of the two,» added Woolard.

Average transaction prices (ATP) are projected to be up 4.2% or $1,509 from a year ago and down 4.5% or $1,759 from December 2020. TrueCar projects that U.S. revenue from new vehicle sales will reach approximately $39 billion for January 2021, down 4.4% (based on a non-adjusted daily selling rate) from a year ago and down 38.2% from last month.

«Average transaction prices have finally come down from the record-setting highs we saw last month, but are still higher than this time last year.  Of the bigger manufacturers, only Kia has an average transaction price below $30,000. We expect this trend to continue as consumers desire pricier trucks and SUVs,» said Alain Nana-Sinkam, Vice President of Industry Insights at TrueCar. «As new vehicle prices rise, we may see more price-conscious shoppers gravitate back towards smaller segments or the used car market due to growing concerns around affordability.»

Additional Insights (forecast by TrueCar):

  • Total retail sales for January 2021 are expected to be up 0.4% from a year ago and down 28.6% from December 2020 when adjusted for the same number of selling days.
  • Fleet sales for January 2021 are expected to be down 23.7% from a year ago and up 8% from December 2020 when adjusted for the same number of selling days.
  • Average transaction price is projected to be up 4.2% or $1,509 from a year ago and down 4.5% or $1,759 from December 2020.
  • Total SAAR is expected to decrease 5.5% from a year ago from 16.8 million units to 15.9 million units.
  • Used vehicle sales for January 2021 are expected to reach 3.2 million, up 1% from a year ago and up 10% from December 2020.
  • The average interest rate on new vehicles is 5.6% and the average interest rate on used vehicles is 8.1%.

January 2021 forecasts for the 13 largest manufacturers by volume. For additional data, visit the TrueCar Newsroom.

Total Unit Sales

Manufacturer

Jan 2021 Forecast

Jan 2020 Actual

Dec 2020 Actual

YoY % Change

YoY % Change

(Daily Selling Rate)

MoM % Change

MoM % Change      (Daily Selling Rate)

BMW

18,358

21,156

45,594

-13.2%

-9.6%

-59.7%

-53.0%

Daimler

15,405

24,111

35,436

-36.1%

-33.4%

-56.5%

-49.3%

Ford

143,106

156,041

208,007

-8.3%

-4.5%

-31.2%

-19.7%

GM

199,403

208,032

295,536

-4.1%

-0.2%

-32.5%

-21.3%

Honda

85,958

101,625

136,467

-15.4%

-11.9%

-37.0%

-26.5%

Hyundai

40,423

44,143

69,388

-8.4%

-4.6%

-41.7%

-32.0%

Kia

36,151

40,355

53,764

-10.4%

-6.7%

-32.8%

-21.6%

Nissan

67,641

80,698

98,638

-16.2%

-12.7%

-31.4%

-20.0%

Stellantis

124,961

135,239

202,371

-7.6%

-3.7%

-38.3%

-28.0%

Subaru

40,624

46,285

63,558

-12.2%

-8.6%

-36.1%

-25.4%

Tesla

26,156

22,350

26,950

17.0%

21.9%

-2.9%

13.2%

Toyota

169,836

166,973

251,256

1.7%

6.0%

-32.4%

-21.1%

Volkswagen Group

39,705

45,377

70,175

-12.5%

-8.9%

-43.4%

-34.0%

Industry

1,048,975

1,143,027

1,619,907

-8.2%

-4.4%

-35.2%

-24.5%

Retail Unit Sales

Manufacturer

Jan 2021 Forecast

Jan 2020 Actual

Dec 2020 Actual

YoY % Change

YoY % Change

(Daily Selling Rate)

MoM % Change

MoM % Change      (Daily Selling Rate)

BMW

17,885

19,578

44,801

-8.6%

-4.8%

-60.1%

-53.4%

Daimler

15,086

22,516

34,711

-33.0%

-30.2%

-56.5%

-49.3%

Ford

111,163

106,861

169,545

4.0%

8.4%

-34.4%

-23.5%

GM

150,681

147,866

256,921

1.9%

6.1%

-41.4%

-31.6%

Honda

85,485

100,679

135,896

-15.1%

-11.6%

-37.1%

-26.6%

Hyundai

35,967

36,720

60,849

-2.0%

2.0%

-40.9%

-31.0%

Kia

32,392

33,393

51,764

-3.0%

1.0%

-37.4%

-27.0%

Nissan

52,674

57,436

81,068

-8.3%

-4.5%

-35.0%

-24.2%

Stellantis

98,062

100,485

167,109

-2.4%

1.7%

-41.3%

-31.5%

Subaru

38,383

43,618

61,188

-12.0%

-8.3%

-37.3%

-26.8%

Tesla

26,144

22,350

26,941

17.0%

21.8%

-3.0%

13.2%

Toyota

143,997

140,984

222,710

2.1%

6.4%

-35.3%

-24.6%

Volkswagen Group

38,243

40,303

69,128

-5.1%

-1.2%

-44.7%

-35.5%

Industry

880,552

913,238

1,437,992

-3.6%

0.4%

-38.8%

-28.6%

Fleet Unit Sales

Manufacturer

Jan 2021 Forecast

Jan 2020 Actual

Dec 2020 Actual

YoY % Change

YoY % Change

(Daily Selling Rate)

MoM % Change

MoM % Change      (Daily Selling Rate)

BMW

472

1,578

793

-70.1%

-68.8%

-40.5%

-30.5%

Daimler

319

1,595

725

-80.0%

-79.2%

-56.0%

-48.7%

Ford

31,943

49,180

38,462

-35.0%

-32.3%

-17.0%

-3.1%

GM

48,722

60,166

38,615

-19.0%

-15.6%

26.2%

47.2%

Honda

473

946

571

-50.0%

-47.9%

-17.2%

-3.3%

Hyundai

4,456

7,423

8,539

-40.0%

-37.5%

-47.8%

-39.1%

Kia

3,759

6,962

2,000

-46.0%

-43.8%

87.9%

119.3%

Nissan

14,966

23,262

17,570

-35.7%

-33.0%

-14.8%

-0.6%

Stellantis

26,900

34,754

35,262

-22.6%

-19.4%

-23.7%

-11.0%

Subaru

2,241

2,667

2,370

-16.0%

-12.5%

-5.4%

10.3%

Tesla

12

9

30.6%

52.4%

Toyota

25,839

25,989

28,546

-0.6%

3.6%

-9.5%

5.6%

Volkswagen Group

1,462

5,074

1,047

-71.2%

-70.0%

39.7%

63.0%

Industry

168,423

229,789

181,915

-26.7%

-23.7%

-7.4%

8.0%

Fleet Penetration

Manufacturer

Jan 2021 Forecast

Jan 2020 Actual

Dec 2020 Actual

YoY % Change

MoM % Change

BMW

2.6%

7.5%

1.7%

-65.5%

47.9%

Daimler

2.1%

6.6%

2.0%

-68.7%

1.2%

Ford

22.3%

31.5%

18.5%

-29.2%

20.7%

GM

24.4%

28.9%

13.1%

-15.5%

87.0%

Honda

0.6%

0.9%

0.4%

-40.9%

31.5%

Hyundai

11.0%

16.8%

12.3%

-34.4%

-10.4%

Kia

10.4%

17.3%

3.7%

-39.7%

179.5%

Nissan

22.1%

28.8%

17.8%

-23.2%

24.2%

Stellantis

21.5%

25.7%

17.4%

-16.2%

23.5%

Subaru

5.5%

5.8%

3.7%

-4.3%

47.9%

Tesla

0.0%

0.0%

0.0%

34.6%

Toyota

15.2%

15.6%

11.4%

-2.3%

33.9%

Volkswagen Group

3.7%

11.2%

1.5%

-67.1%

146.9%

Industry

16.1%

20.1%

11.2%

-20.1%

43.0%

Total Market Share

Manufacturer

Jan 2021 Forecast

Jan 2020 Actual

Dec 2020 Actual

BMW

1.8%

1.9%

2.8%

Daimler

1.5%

2.1%

2.2%

Ford

13.6%

13.7%

12.8%

GM

19.0%

18.2%

18.2%

Honda

8.2%

8.9%

8.4%

Hyundai

3.9%

3.9%

4.3%

Kia

3.4%

3.5%

3.3%

Nissan

6.4%

7.1%

6.1%

Stellantis

11.9%

11.8%

12.5%

Subaru

3.9%

4.0%

3.9%

Tesla

2.5%

2.0%

1.7%

Toyota

16.2%

14.6%

15.5%

Volkswagen Group

3.8%

4.0%

4.3%

Retail Market Share

Manufacturer

Jan 2021 Forecast

Jan 2020 Actual

Dec 2020 Actual

BMW

2.0%

2.1%

3.1%

Daimler

1.7%

2.5%

2.4%

Ford

12.6%

11.7%

11.8%

GM

17.1%

16.2%

17.9%

Honda

9.7%

11.0%

9.5%

Hyundai

4.1%

4.0%

4.2%

Kia

3.7%

3.7%

3.6%

Nissan

6.0%

6.3%

5.6%

Stellantis

11.1%

11.0%

11.6%

Subaru

4.4%

4.8%

4.3%

Tesla

3.0%

2.4%

1.9%

Toyota

16.4%

15.4%

15.5%

Volkswagen Group

4.3%

4.4%

4.8%

Average Transaction Price (ATP)

Manufacturer

Jan 2021 Forecast

Jan 2020 Actual

Dec 2020 Actual

YOY

MOM

BMW

$58,473

$57,090

$59,710

2.4%

-2.1%

Daimler

$61,867

$60,853

$61,087

1.7%

1.3%

Ford

$43,580

$42,543

$44,354

2.4%

-1.7%

GM

$41,852

$39,522

$43,735

5.9%

-4.3%

Honda

$30,740

$29,220

$30,959

5.2%

-0.7%

Hyundai

$31,273

$28,324

$30,477

10.4%

2.6%

Kia

$28,204

$25,647

$28,137

10.0%

0.2%

Nissan

$30,068

$29,351

$29,965

2.4%

0.3%

Stellantis

$42,886

$40,590

$43,259

5.7%

-0.9%

Subaru

$30,564

$30,032

$30,789

1.8%

-0.7%

Toyota

$34,995

$33,379

$35,321

4.8%

-0.9%

Volkswagen Group

$43,040

$40,787

$42,920

5.5%

0.3%

Industry

$37,330

$35,821

$39,089

4.2%

-4.5%

Incentive Spending

Manufacturer

Jan 2021 Forecast

Jan 2020 Actual

Dec 2020 Actual

YOY

MOM

BMW

$4,687

$5,812

$5,233

-19.4%

-10.4%

Daimler

$4,187

$6,246

$4,438

-33.0%

-5.7%

Ford

$3,925

$4,926

$4,464

-20.3%

-12.1%

GM

$5,537

$5,673

$4,971

-2.4%

11.4%

Honda

$2,862

$2,520

$2,455

13.6%

16.6%

Hyundai

$2,281

$3,092

$2,536

-26.2%

-10.0%

Kia

$2,605

$3,686

$2,999

-29.3%

-13.1%

Nissan

$4,062

$4,842

$4,586

-16.1%

-11.4%

Stellantis

$5,284

$5,027

$4,681

5.1%

12.9%

Subaru

$1,512

$1,244

$1,505

21.5%

0.5%

Toyota

$2,466

$2,679

$2,755

-8.0%

-10.5%

Volkswagen Group

$3,754

$4,407

$4,256

-14.8%

-11.8%

Industry

$3,839

$4,151

$3,869

-7.5%

-0.8%

Incentives as a Percentage of Average Transaction Price (ATP)

Manufacturer

Jan 2021 Forecast

Jan 2020 Actual

Dec 2020 Actual

YOY

MOM

BMW

8.0%

10.2%

8.8%

-21.3%

-8.5%

Daimler

6.8%

10.3%

7.3%

-34.1%

-6.8%

Ford

9.0%

11.6%

10.1%

-22.2%

-10.5%

GM

13.2%

14.4%

11.4%

-7.8%

16.4%

Honda

9.3%

8.6%

7.9%

8.0%

17.4%

Hyundai

7.3%

10.9%

8.3%

-33.2%

-12.3%

Kia

9.2%

14.4%

10.7%

-35.7%

-13.3%

Nissan

13.5%

16.5%

15.3%

-18.1%

-11.7%

Stellantis

12.3%

12.4%

10.8%

-0.5%

13.9%

Subaru

4.9%

4.1%

4.9%

19.4%

1.2%

Toyota

7.0%

8.0%

7.8%

-12.2%

-9.7%

Volkswagen Group

8.7%

10.8%

9.9%

-19.3%

-12.0%

Industry

10.3%

11.6%

9.9%

-11.2%

3.9%

(Note: This forecast is based solely on TrueCar, Inc.’s analysis of industry sales trends and conditions and is not a projection of TrueCar, Inc.’s operations.)

About TrueCar
TrueCar is a leading automotive digital marketplace that enables car buyers to connect to our nationwide network of Certified Dealers. We are building the industry’s most personalized and efficient car buying experience as we seek to bring more of the purchasing process online. Consumers who visit our marketplace will find a suite of vehicle discovery tools, price ratings, and market context on new and used cars – all with a clear view of what’s a great deal. When they are ready, TrueCar will enable them to connect with a local Certified Dealer who shares in our belief that truth, transparency, and fairness are the foundation of a great car buying experience. As part of our marketplace, TrueCar powers car-buying programs for over 250 leading brands, including AARP, Sam’s Club, and American Express. Nearly half of all new-car buyers engage with TrueCar powered sites, where they buy smarter and drive happier. TrueCar is headquartered in Santa Monica, California, with offices in Austin, Texas, and Boston, Massachusetts.

For more information, please visit www.truecar.com, and follow us on Facebook or Twitter. TrueCar media line: +1-844-469-8442 (US toll-free) | Email: pr@truecar.com 

TrueCar PR Contacts:
Shadee Malekafzali
shadee@truecar.com
424.258.8694

Tanya Kohan
tkohan@truecar.com
714.425.6319

Cision View original content to download multimedia:http://www.prnewswire.com/news-releases/truecar-forecasts-new-and-used-retail-sales-up-slightly-year-over-year-for-january-2021-while-fleet-recovery-drags-301214612.html

SOURCE Truecar, Inc.

Toyota Research Institute Launches Next Phase of Collaborative Research With Diverse Roster of World-Class Academic Institutions

LOS ALTOS, Calif., Jan. 26, 2021 /PRNewswire/ — The Toyota Research Institute (TRI) announced today that it has selected 13 additional academic institutions to participate in the next five-year phase of its collaborative research program. These universities join MIT, Stanford and the University of Michigan which have worked with TRI over the last five years to expand the body of research into artificial intelligence…

LOS ALTOS, Calif., Jan. 26, 2021 /PRNewswire/ — The Toyota Research Institute (TRI) announced today that it has selected 13 additional academic institutions to participate in the next five-year phase of its collaborative research program. These universities join MIT, Stanford and the University of Michigan which have worked with TRI over the last five years to expand the body of research into artificial intelligence (AI) with the goal of amplifying the human experience.

The next five-year phase includes investing more than $75 million in the academic institutions, making it one of the largest collaborative research programs by an automotive company in the world.

«Our first five-year program pushed the boundaries of exploratory research across multiple fields, generating 69 patent applications and nearly 650 papers,» said Eric Krotkov, TRI Chief Science Officer who leads the university research program. «Our next five years are about pushing even further and doing so with a broader, more diverse set of stakeholders.  To get to the best ideas, collaboration is critical.  Our aim is to build a pipeline of new ideas from different perspectives and underrepresented voices that share our vision of using AI for human amplification and societal good.»   

The following universities completed a comprehensive proposal submission and review process and will participate in the next phase of TRI’s collaborative research program: 

  1. Carnegie Mellon University
  2. Columbia University
  3. Florida A&M UniversityFlorida State University College of Engineering
  4. Georgia Institute of Technology (Georgia Tech)
  5. Indiana University
  6. Massachusetts Institute Technology (MIT)
  7. Princeton University
  8. Smith College
  9. Stanford University
  10. Toyota Technological Institute at Chicago (TTIC)
  11. University of California, Berkeley
  12. University of Illinois
  13. University of Michigan
  14. University of Minnesota
  15. University of Pennsylvania
  16. UCLA

Through this program, TRI will lead 35 joint research projects focused on achieving breakthroughs around difficult technological challenges in TRI’s research areas: Automated Driving, Robotics and Machine Assisted Cognition (MAC). 

The primary objectives of the joint research projects are to:

  • Contribute significant new knowledge and understanding to the artificial intelligence field.
  • Demonstrate the potential to radically advance state of the art concepts into possible use cases.
  • Promote the transfer of knowledge through the meaningful exchange of scientific and technical information between TRI researchers and academic partners.
  • Create and share infrastructure, including data and software, to further research, promote reproducibility and support education.

The first phase of the program, conducted over the last five years, sponsored 98 projects involving about 100 faculty members and over 200 students. These projects yielded important technology advances for ongoing TRI projects, including transfer learning in computer vision, self-supervised learning on contact-rich tasks, and techniques for mimicking human behavior in various driving interactions. The projects generated several awards for published papers at leading conferences including the CVPR 2018 Best Paper, an ICRA 2019 Finalist Best Paper, the ICRA 2019 Best Paper, and the 2020 IEEE Robotics and Automation Letters Best Paper Award. Additionally, the close collaborations resulted in the recruitment of several new TRI team members.

This next five-year phase focuses investments in projects TRI researchers have a keen academic interest in exploring to create more value and impact for TRI. Each project features a TRI researcher as a co-investigator who will work with the university partner. This approach directly engages TRI researchers with the academic AI partners and ensures that the research contributes to the TRI mission.

TRI is also offering Young Faculty Researcher (YFR) projects to form partnerships with more junior (typically pre-tenure) faculty members. Whereas joint projects have TRI pursuing a specific direction and reaching technical milestones along the way, the YFR projects are specifically designed to support promising tenure stream faculty members, enabling them to explore broadly, inquire deeply, and address higher-risk, higher-payoff ideas. In YFR projects, TRI invests in the researcher and provides them with the freedom and flexibility to pivot from one direction to another.  

About Toyota Research Institute
Toyota Research Institute (TRI), established in 2015, aims to develop active vehicle safety and automated driving technologies, robotics, and other human amplification technology.  Led by Dr. Gill Pratt, TRI’s researchers use artificial intelligence to benefit society and improve the human condition by creating a future where everyone has the freedom to move, engage, and explore. TRI is based in the United States, with offices in Los Altos, California, Cambridge, Massachusetts, and Ann Arbor, Michigan. For more information about TRI, please visit http://tri.global.

Media Contacts

Stephen Hughes
Communications Mgr
Toyota Research Institute
Stephen.Hughes@tri.global
650-422-8947

Wendy Rosen
Communications Dir.
Toyota Research Institute
Wendy.Rosen@tri.global
650-284-6429

Cision View original content to download multimedia:http://www.prnewswire.com/news-releases/toyota-research-institute-launches-next-phase-of-collaborative-research-with-diverse-roster-of-world-class-academic-institutions-301215071.html

SOURCE Toyota Research Institute

VinSolutions Introduces Its Automotive Marketing Platform to Help Dealers Take Charge of Their Campaigns

MISSION, Kan., Jan. 26, 2021 /PRNewswire/ — Dealers share a common goal to engage customers and maximize profits but doing so efficiently while minimizing marketing spend can prove challenging. With the new Automotive Marketing Platform powered by…

MISSION, Kan., Jan. 26, 2021 /PRNewswire/ — Dealers share a common goal to engage customers and maximize profits but doing so efficiently while minimizing marketing spend can prove challenging. With the new Automotive Marketing Platform powered by VinSolutions, dealers can elevate their marketing without increasing their workload. Automotive Marketing Platform is a marketing tool that integrates with the CRM providing an end-to-end view across marketing and sales. This enables dealers to leverage data insights and automate workflows to deliver personalized experiences across the ownership lifecycle. Ultimately, Automotive Marketing Platform is the complete package for driving consumer engagement and helping to maximize ROI.

«Until now, dealerships had to manage campaigns across different departments, vendors and marketing channels, which inevitably created inconsistencies, depleted resources and compressed ROI,» said Tracy Fred, vice president of operations for Cox Automotive brands VinSolutions, Xtime and Dealertrack DMS. «With centralization and automation, Automotive Marketing Platform addresses the reality that two-thirds of a salesperson’s time is typically spent on non-revenue-generating activities like managing different tools across departments and duplicate data entry.1«

Automotive Marketing Platform helps protect dealership revenue with improved customer engagement, greater efficiency in marketing spend, increased marketing reach across departments, time-saving automation and centralization, and superior campaign performance. Key features include:

  • CRM Integration: Marketing activity is stored directly in the customer record in VinSolutions’ Connect dealership CRM instead of another tool, making it easier to guide personalized conversations, determine next steps and avoid duplicated efforts that frustrate customers and team members alike.
  • Automated Marketing Workflows: Marketing outreach is informed by data science and real customer behaviors, creating a series of «if, then» scenarios throughout the process that allows communication to be both automated and personalized.
  • Data Insights: Cox Automotive proprietary data identifies the types of customers who are most likely to be ready to buy based on their online behavior, maximizing sales opportunities, and proactively converting leads before they are even submitted.
  • Automated Offers Engine: With access to customer data from Kelley Blue Book and Autotrader, Automotive Marketing Platform sends customers personalized offers, matching them with current inventory and including personalized payment recommendations based on their equity position and applicable incentives data.
  • Marketing Account Manager: All campaigns built in Automotive Marketing Platform are backed by the support of a dedicated Marketing Account Manager, an automotive marketing specialist who guides and executes the dealership’s strategic marketing direction.
  • Dashboard/Reporting: A robust reporting dashboard enables dealerships to quickly understand the performance of campaigns and channels so impactful adjustments can be made effectively, helping to maximize ROI on marketing spend.
  • Marketing Channels: Recommendations and automated CRM tasks ensure customers are reached on the right channels, including email, phone calls, and Facebook/Instagram ads.

«One of the greatest strengths of Automotive Marketing Platform is being able to target customers with the right message, at the right time—at the right moment when the customer is most likely to act and create opportunities for our stores,» added Justin Harmon, Marketing Director, Eide Automotive Group.

The Automated Marketing Platform joins VinSolutions’ portfolio of products that leverage data science and artificial intelligence, including Connect Automotive Intelligence. In addition to providing salespeople with insights to better understand their customers, dealers will now be able to use Connect AI Buying Signals as a lead source with the new automated lead creation functionality. Connect AI and Automotive Marketing Platform can be purchased separately as well as integrate seamlessly to create even more powerful and accurate customer engagement.

To learn more about Automotive Marketing Platform powered by VinSolutions, visit www.vinsolutions.com.  

About VinSolutions 

As the provider of Connect CRM, Connect Automotive Intelligence, and the supporting suite of Connect solutions, VinSolutions helps more than 6,000 dealers make every connection count. VinSolutions’ industry-leading tools—including customizable customer relationship management, artificial intelligence, and desking—help dealerships drive more leads, increase profits, and accelerate the path to purchase. Founded in 2006 and headquartered in Mission, Kansas, VinSolutions fosters dealership success by providing a fully customizable suite of solutions, including equity mining, market pricing and desking tools, combined with the continuous, personal support of a designated Performance Manager. VinSolutions is OEM certified by every major manufacturer and is Autosoft, CDK, Reynolds & Reynolds and Dealertrack DMS certified. www.vinsolutions.com 

About Cox Automotive

Cox Automotive Inc. makes buying, selling, owning and using vehicles easier for everyone. The global company’s more than 27,000 team members and family of brands, including Autotrader®, Clutch Technologies, Dealer.com®, Dealertrack®, Kelley Blue Book®, Manheim®, NextGear Capital®, VinSolutions®, vAuto® and Xtime®, are passionate about helping millions of car shoppers, 40,000 auto dealer clients across five continents and many others throughout the automotive industry thrive for generations to come. Cox Automotive is a subsidiary of Cox Enterprises Inc., a privately-owned, Atlanta-based company with annual revenues of nearly $20 billion. www.coxautoinc.com

1 «Why Sales Reps Spend Less Than 36% of Time Selling (And Less Than 18% In CRM).» Krogue, Ken. Jan. 10, 2018


Cision View original content to download multimedia:http://www.prnewswire.com/news-releases/vinsolutions-introduces-its-automotive-marketing-platform-to-help-dealers-take-charge-of-their-campaigns-301214907.html

SOURCE VinSolutions

Viking Announces New Nile River Ship For 2022

LOS ANGELES, Jan. 26, 2021 /PRNewswire/ — Viking® (www.viking.com) today announced an expansion of its Egypt fleet with

LOS ANGELES, Jan. 26, 2021 /PRNewswire/ — Viking® (www.viking.com) today announced an expansion of its Egypt fleet with Viking Aton, a new state-of-the-art river vessel. Inspired by the design of the award-winning Viking Longships® and built specifically to navigate the Nile River, Viking Aton is currently under construction and is scheduled to debut in September 2022. Sailing on Viking’s popular Pharaohs & Pyramids itinerary, the new vessel will join Viking’s existing Egypt river fleet, which includes its identical sister ship Viking Osiris and Viking’s first owned and operated ship on the Nile, Viking Ra®.

«Egypt remains a top destination for many of our guests who are inspired to discover the rich history and beauty of the region,» said Torstein Hagen, Chairman of Viking. «We will always maintain our commitment to creating meaningful experiences that are focused on the destination. The addition of Viking Aton is a reflection of our continued investment in Egypt; we look forward to introducing the country’s cultural treasures to even more Viking guests in the future.»

Viking Aton

Hosting 82 guests in 41 staterooms, Viking Aton will be a state-of-the-art ship with the clean, elegant Scandinavian design for which Viking is known. Viking Aton‘s features include all outside staterooms with river views; spacious suites with two full-size rooms and verandas; a pool and sun deck with 360-degree views; Viking Lounge with floor-to-ceiling glass doors; and Viking’s revolutionary Aquavit Terrace ideal for al fresco dining and indoor/outdoor viewing along the Nile River. Viking Aton will join the company’s other ships on the Nile, Viking Osiris, which is set to launch in 2021, and Viking Ra, which launched in 2018. Viking is the first and only Western company to build, own and operate ships on the Nile.

Pharaohs & Pyramids

During the 12-day, Pharaohs & Pyramids cruisetour itinerary, guests begin with a three-night stay at a first-class hotel in Cairo, where guests can visit iconic sites such as the Great Pyramids of Giza, the necropolis of Sakkara and the Mosque of Muhammad Ali. Guests then fly to Luxor, where they visit the Temples of Luxor and Karnak before boarding a Viking river ship for an eight-day roundtrip cruise on the Nile River, featuring Privileged Access® to the tomb of Nefertari in the Valley of the Queens and the tomb of Tutankhamen in the Valley of the Kings, and excursions to the Temple of Khnum in Esna, the Dendera Temple complex in Qena, the temples at Abu Simbel and the High Dam in Aswan, and a visit to a colorful Nubian village, where guests can experience a traditional elementary school. Finally, the journey concludes with a flight back to Cairo for a final night in the ancient city.

For guests looking to extend their journey, Viking also offers Pre and Post-Cruise Extensions that provide Privileged Access to archives and exhibits. Building on the success of the Oxford & Highclere Castle program – one of Viking’s highest-rated Pre/Post Extension that visits the filming location of «Downton Abbey» – the company has applied the same degree of Privileged Access to a new curated Pre-Cruise Extensions that allows guests to retrace the steps of the world’s most famous Egyptologist, Howard Carter, and his benefactor, the 5th Earl of Carnarvon. Guests on the five-day British Collections of Ancient Egypt extension will begin the journey in London, where they will meet their Viking Tour Director, an expert Egyptologist, and experience Privileged Access to two museums: first a private, early morning visit to the Egyptian Collection at the British Museum before it opens to the general public – and then a visit to the home and personal museum of world-renowned architect, Sir John Soane, where the tour will be illuminated by candlelight, a re-enactment of how Soane entertained guests and showcased his exquisite collection of Egyptian antiquities, including a 3,000-year-old Egyptian sarcophagus. Guests will also visit London’s Petrie Museum, which houses more than 80,000 artifacts from ancient Egypt and Sudan. In Oxford, guests will visit the Ashmolean Museum, one of the oldest in the world, and home to a varied collection of Egyptian mummies and art – and go behind the scenes at Oxford University’s Griffith Institute, where they will enjoy a Privileged Access visit to see Carter’s archives, which detail the discovery of Tutankhamun’s tomb. Lastly, guests will have further Privileged Access with an exclusive visit to Highclere Castle – the country seat of the Earl and Countess of Carnarvon – to view the Earl’s magnificent private collection of Egyptian artifacts, as well as archives and exhibits not normally accessible to the public.

Additional offerings include a Pre-Cruise Extension in Jerusalem where guests will explore the ancient history and vibrant culture of Israel’s fascinating capital and a Post-Cruise Extension to Jordan – Petra, Dead Sea & Amman to view Roman antiquities at Jerash, Crusader-era castles at Kerak or Shobak and experience the lost city of Petra, a UNESCO World Heritage Site.

Booking Details

From now through January 31, 2021, U.S. residents can take advantage of special savings on cruise fares and up to free international airfare on select 2021 – 2023 ocean and river itineraries.

About Viking

Viking was founded in 1997 and provides destination-focused journeys on rivers, oceans and lakes around the world. Designed for experienced travelers with interests in science, history, culture and cuisine, Chairman Torstein Hagen often says Viking offers guests The Thinking Person’s Cruise® in contrast to mainstream cruises. In its first five years of operation, Viking has been rated the #1 ocean cruise line in Travel + Leisure‘s 2016, 2017, 2018, 2019 and 2020 «World’s Best» Awards. In addition to the Travel + Leisure honors, Viking has also been honored multiple times on Condé Nast Traveler‘s «Gold List» as well as recognized by Cruise Critic as «Best Overall» Small-Mid size ship in the 2018 Cruisers’ Choice Awards, «Best River Cruise Line» and «Best River Itineraries,» with the entire Viking Longships® fleet being named «Best New River Ships» in the website’s Editors’ Picks Awards. For additional information, contact Viking at 1-800-2-VIKING (1-800-284-5464) or visit www.viking.com. For Viking’s award-winning enrichment channel, visit www.viking.tv.

Cision View original content to download multimedia:http://www.prnewswire.com/news-releases/viking-announces-new-nile-river-ship-for-2022-301215042.html

SOURCE Viking

Step Into A Vintage Paradise With New Fine Art Photography Series «Gray Malin At The Mauna Kea»

WAIMEA, Hawaii, Jan. 26, 2021 /PRNewswire-PRWeb/ — Fine art photographer Gray Malin has partnered with Mauna Kea Beach Hotel to debut his most recent fine art series – Gray Malin at the Mauna Kea. Inspired by the beautifully unique spirit of the island of Hawai’i, the series celebrates the resort’s dream-worthy setting along the shores of Kauna’oa Bay. A beloved and historic property developed by Laurance…

WAIMEA, Hawaii, Jan. 26, 2021 /PRNewswire-PRWeb/ — Fine art photographer Gray Malin has partnered with Mauna Kea Beach Hotel to debut his most recent fine art series – Gray Malin at the Mauna Kea. Inspired by the beautifully unique spirit of the island of Hawai’i, the series celebrates the resort’s dream-worthy setting along the shores of Kauna’oa Bay. A beloved and historic property developed by Laurance S. Rockefeller in 1965, Mauna Kea Beach Hotel has a timeless legacy that is the epitome of luxury, relaxation, and paradise, all of which Gray pays tribute to in his series. Utilizing vintage props, colorful surfboards and striped beachside umbrellas, Gray brings to life carefully crafted moments throughout the resort’s most iconic and eye-catching locations.

Across 32 breathtaking images, the collection perfectly marries the natural beauty of Hawai’i Island with the understated elegance of the resort itself, invoking both nostalgia for the simpler days of yesteryear along with excitement for future vacations to come. Endless palm trees, vibrant blue ocean waves, sandy white beaches and sunset hues paint a picture of a serene lifestyle and heavenly scenery that can only be experienced in Hawai’i. Notable locations that Gray features in his series include Hau Tree, a favorite beachfront lounge to dine and enjoy the famous Fredrico cocktail; Hole 3, the most celebrated hole at the legendary championship golf course; and the front entrance which offers a warm welcome for newcomers and loyal guests alike.

Due to restrictions at the time of the shoot, Gray had exclusive access to the resort, allowing him to photograph various locations while they were closed to resort guests and to emulate a dreamy and idyllic island lifestyle through the images. Though Gray is well known for capturing organic aerial beach scenes, this was the first production where Gray was able to style a custom Gray Malin beach club, reimagining a vintage beach scene complete with over 30 custom umbrellas that feature the signature Mauna Kea orange.

«Working with the Mauna Kea for this project was a dream,» says Gray Malin. «I have had my mind set on shooting this luxury resort for a while and it is incredible that we were able to make it happen during this unpredictable year. I was lucky enough to shoot the resort while it was closed down, giving me the opportunity to highlight the property’s iconic locations in the most serene fashion. I am very proud of how the historic hotel and the island of Hawai’i are celebrated in this series.»

«We are honored to see the timeless beauty of Mauna Kea Beach Hotel come alive in this new photography series from Gray Malin,» said Craig Anderson, Vice President of Operations for Mauna Kea Resort. «From our sun-soaked beach cove that draws travelers from around the world to our orange beach buggy filled with vintage surfboards, this collection captures the feel-good spirit of Mauna Kea that has kept guests coming back for generations.»

Signed and numbered prints will be available as limited editions on http://www.graymalin.com/gray-malin-at-the-mauna-kea and select prints from the series will be available at the Mauna Kea Beach Hotel gift shop beginning Jan. 26. For more information on Mauna Kea Beach Hotel, please visit http://www.MaunaKeaBeachHotel.com.

ABOUT GRAY MALIN:
Gray Malin is a modern day fine art photographer, New York Times Bestselling Author and CEO of his namesake brand, Gray Malin. With the philosophy to Make Every Day a Getaway®, Gray’s photography has expanded into a line of luxury products for home and travel.

He has shot over 30 series around the world in locations as remote as Antarctica and Bhutan while also receiving commercial recognition for inventive aerial beach, ski, and park scenes of the world’s most iconic destinations. With his keen ability to capture the essence of particular locations, he has had the coveted opportunity to photograph some of the country’s most celebrated properties such as The Beverly Hills Hotel, Rockefeller Center and The Breakers Palm Beach.

Gray Malin has partnered with numerous global brands such as Disney, Google, Neiman Marcus, Bugaboo, Away, Ladurée, Le Meridien and more. These partnerships range from commissioned shoots to product and content collaborations, allowing audiences to interact with his art in new and exciting ways.

For more information on prints, partnerships, and products, visit http://www.GrayMalin.com.

Media Contact – Gray Malin
Gigi Avendaño
press@graymalin.com
(424) 335-0278

ABOUT MAUNA KEA BEACH HOTEL:
Five decades after opening in 1965, the Laurance S. Rockefeller-developed Mauna Kea Beach Hotel continues its timeless legacy on the golden Kohala Coast of Hawai’i Island. Tucked away along an idyllic beach cove with a sparkling white sand beach, the resort celebrates the ocean, land and aloha spirit of Hawaii. Guests can unwind, renew and enjoy Mauna Kea moments across breathtaking indoor and outdoor spaces that carry out the resort’s signature understated elegance, mid-century modern design, and world-class Pacific Rim art collection. Mauna Kea Beach Hotel offers 252 spacious guest rooms and suites with private lanais and scenic ocean or golf course views as well as four restaurants & lounges including the beachfront Hau Tree and stunning open-air Manta restaurant. Resort amenities also include an outdoor swimming pool with luxury cabanas; an intimate Mauna Kea Spa by Mandara; a 2,500 square foot fitness center; the legendary 18-hole Mauna Kea Golf Course which established Hawaii as a golfer’s paradise; the 11-court Seaside Tennis Club; and a daily Mauna Kea Keiki Club for children ages 5-12. Beach services include beach umbrellas and padded chaise lounges while ocean activities include snorkeling, kayaking and stand-up paddle boarding. Art and history enthusiasts can enjoy complimentary art tours each Saturday.

For more information about Mauna Kea Beach Hotel, please visit http://www.MaunaKeaBeachHotel.com, call 808.882.7222 or follow along at @maunakeahotel.

Media Contact – Mauna Kea Beach Hotel
Murphy O’Brien
princeresortshawaii@murphyobrien.com
(310) 453-2539

Media Contact

Alison Burns, Murphy O’Brien, +1 (916) 802-7620, princeresortshawaii@murphyobrien.com


SOURCE Gray Malin

TrueCar Forecasts New and Used Retail Sales Up Slightly Year-Over-Year for January 2021, While Fleet Recovery Drags

SANTA MONICA, Calif., Jan. 26, 2021 /PRNewswire/ — TrueCar, Inc. projects total new vehicle sales will reach 1,048,975 units in January 2021, down 4.4% from a year ago when adjusted for the same number of selling days. This month’s seasonally adjusted annualized rate (SAAR) for total light vehicle sales is an estimated 15.9…

SANTA MONICA, Calif., Jan. 26, 2021 /PRNewswire/ — TrueCar, Inc. projects total new vehicle sales will reach 1,048,975 units in January 2021, down 4.4% from a year ago when adjusted for the same number of selling days. This month’s seasonally adjusted annualized rate (SAAR) for total light vehicle sales is an estimated 15.9 million units. Excluding fleet sales, TrueCar expects U.S. retail deliveries of new cars and light trucks to be 880,552 units, an increase of 0.4% from a year ago when adjusted for the same number of selling days. Used vehicle sales for January 2021 are expected to reach 3.2 million, up 1% from a year ago and up 10% from December 2020. 

«Entering 2021 with retail sales in line with last year is a big win for the automotive industry,» said Nick Woolard, Lead Industry Analyst at TrueCar. «However, while retail sales have rebounded, rental fleets remained depressed and continue to interrupt fleet sales. . As a result, fleet sales are struggling to come back to pre-pandemic levels and are driving total unit sales down.»

«The automotive industry continues to reap the benefits of continued strength in retail demand with lower incentive spend. A handful of brands such as Ford, Genesis, GMC, Ram and Toyota, appear to be in the coveted quadrant of both retail growth as well as incentive decline. This is mostly driven by new product and being in the right segments or a combination of the two,» added Woolard.

Average transaction prices (ATP) are projected to be up 4.2% or $1,509 from a year ago and down 4.5% or $1,759 from December 2020. TrueCar projects that U.S. revenue from new vehicle sales will reach approximately $39 billion for January 2021, down 4.4% (based on a non-adjusted daily selling rate) from a year ago and down 38.2% from last month.

«Average transaction prices have finally come down from the record-setting highs we saw last month, but are still higher than this time last year.  Of the bigger manufacturers, only Kia has an average transaction price below $30,000. We expect this trend to continue as consumers desire pricier trucks and SUVs,» said Alain Nana-Sinkam, Vice President of Industry Insights at TrueCar. «As new vehicle prices rise, we may see more price-conscious shoppers gravitate back towards smaller segments or the used car market due to growing concerns around affordability.»

Additional Insights (forecast by TrueCar):

  • Total retail sales for January 2021 are expected to be up 0.4% from a year ago and down 28.6% from December 2020 when adjusted for the same number of selling days.
  • Fleet sales for January 2021 are expected to be down 23.7% from a year ago and up 8% from December 2020 when adjusted for the same number of selling days.
  • Average transaction price is projected to be up 4.2% or $1,509 from a year ago and down 4.5% or $1,759 from December 2020.
  • Total SAAR is expected to decrease 5.5% from a year ago from 16.8 million units to 15.9 million units.
  • Used vehicle sales for January 2021 are expected to reach 3.2 million, up 1% from a year ago and up 10% from December 2020.
  • The average interest rate on new vehicles is 5.6% and the average interest rate on used vehicles is 8.1%.

January 2021 forecasts for the 13 largest manufacturers by volume. For additional data, visit the TrueCar Newsroom.

Total Unit Sales

Manufacturer

Jan 2021 Forecast

Jan 2020 Actual

Dec 2020 Actual

YoY % Change

YoY % Change

(Daily Selling Rate)

MoM % Change

MoM % Change      (Daily Selling Rate)

BMW

18,358

21,156

45,594

-13.2%

-9.6%

-59.7%

-53.0%

Daimler

15,405

24,111

35,436

-36.1%

-33.4%

-56.5%

-49.3%

Ford

143,106

156,041

208,007

-8.3%

-4.5%

-31.2%

-19.7%

GM

199,403

208,032

295,536

-4.1%

-0.2%

-32.5%

-21.3%

Honda

85,958

101,625

136,467

-15.4%

-11.9%

-37.0%

-26.5%

Hyundai

40,423

44,143

69,388

-8.4%

-4.6%

-41.7%

-32.0%

Kia

36,151

40,355

53,764

-10.4%

-6.7%

-32.8%

-21.6%

Nissan

67,641

80,698

98,638

-16.2%

-12.7%

-31.4%

-20.0%

Stellantis

124,961

135,239

202,371

-7.6%

-3.7%

-38.3%

-28.0%

Subaru

40,624

46,285

63,558

-12.2%

-8.6%

-36.1%

-25.4%

Tesla

26,156

22,350

26,950

17.0%

21.9%

-2.9%

13.2%

Toyota

169,836

166,973

251,256

1.7%

6.0%

-32.4%

-21.1%

Volkswagen Group

39,705

45,377

70,175

-12.5%

-8.9%

-43.4%

-34.0%

Industry

1,048,975

1,143,027

1,619,907

-8.2%

-4.4%

-35.2%

-24.5%

Retail Unit Sales

Manufacturer

Jan 2021 Forecast

Jan 2020 Actual

Dec 2020 Actual

YoY % Change

YoY % Change

(Daily Selling Rate)

MoM % Change

MoM % Change      (Daily Selling Rate)

BMW

17,885

19,578

44,801

-8.6%

-4.8%

-60.1%

-53.4%

Daimler

15,086

22,516

34,711

-33.0%

-30.2%

-56.5%

-49.3%

Ford

111,163

106,861

169,545

4.0%

8.4%

-34.4%

-23.5%

GM

150,681

147,866

256,921

1.9%

6.1%

-41.4%

-31.6%

Honda

85,485

100,679

135,896

-15.1%

-11.6%

-37.1%

-26.6%

Hyundai

35,967

36,720

60,849

-2.0%

2.0%

-40.9%

-31.0%

Kia

32,392

33,393

51,764

-3.0%

1.0%

-37.4%

-27.0%

Nissan

52,674

57,436

81,068

-8.3%

-4.5%

-35.0%

-24.2%

Stellantis

98,062

100,485

167,109

-2.4%

1.7%

-41.3%

-31.5%

Subaru

38,383

43,618

61,188

-12.0%

-8.3%

-37.3%

-26.8%

Tesla

26,144

22,350

26,941

17.0%

21.8%

-3.0%

13.2%

Toyota

143,997

140,984

222,710

2.1%

6.4%

-35.3%

-24.6%

Volkswagen Group

38,243

40,303

69,128

-5.1%

-1.2%

-44.7%

-35.5%

Industry

880,552

913,238

1,437,992

-3.6%

0.4%

-38.8%

-28.6%

Fleet Unit Sales

Manufacturer

Jan 2021 Forecast

Jan 2020 Actual

Dec 2020 Actual

YoY % Change

YoY % Change

(Daily Selling Rate)

MoM % Change

MoM % Change      (Daily Selling Rate)

BMW

472

1,578

793

-70.1%

-68.8%

-40.5%

-30.5%

Daimler

319

1,595

725

-80.0%

-79.2%

-56.0%

-48.7%

Ford

31,943

49,180

38,462

-35.0%

-32.3%

-17.0%

-3.1%

GM

48,722

60,166

38,615

-19.0%

-15.6%

26.2%

47.2%

Honda

473

946

571

-50.0%

-47.9%

-17.2%

-3.3%

Hyundai

4,456

7,423

8,539

-40.0%

-37.5%

-47.8%

-39.1%

Kia

3,759

6,962

2,000

-46.0%

-43.8%

87.9%

119.3%

Nissan

14,966

23,262

17,570

-35.7%

-33.0%

-14.8%

-0.6%

Stellantis

26,900

34,754

35,262

-22.6%

-19.4%

-23.7%

-11.0%

Subaru

2,241

2,667

2,370

-16.0%

-12.5%

-5.4%

10.3%

Tesla

12

9

30.6%

52.4%

Toyota

25,839

25,989

28,546

-0.6%

3.6%

-9.5%

5.6%

Volkswagen Group

1,462

5,074

1,047

-71.2%

-70.0%

39.7%

63.0%

Industry

168,423

229,789

181,915

-26.7%

-23.7%

-7.4%

8.0%

Fleet Penetration

Manufacturer

Jan 2021 Forecast

Jan 2020 Actual

Dec 2020 Actual

YoY % Change

MoM % Change

BMW

2.6%

7.5%

1.7%

-65.5%

47.9%

Daimler

2.1%

6.6%

2.0%

-68.7%

1.2%

Ford

22.3%

31.5%

18.5%

-29.2%

20.7%

GM

24.4%

28.9%

13.1%

-15.5%

87.0%

Honda

0.6%

0.9%

0.4%

-40.9%

31.5%

Hyundai

11.0%

16.8%

12.3%

-34.4%

-10.4%

Kia

10.4%

17.3%

3.7%

-39.7%

179.5%

Nissan

22.1%

28.8%

17.8%

-23.2%

24.2%

Stellantis

21.5%

25.7%

17.4%

-16.2%

23.5%

Subaru

5.5%

5.8%

3.7%

-4.3%

47.9%

Tesla

0.0%

0.0%

0.0%

34.6%

Toyota

15.2%

15.6%

11.4%

-2.3%

33.9%

Volkswagen Group

3.7%

11.2%

1.5%

-67.1%

146.9%

Industry

16.1%

20.1%

11.2%

-20.1%

43.0%

Total Market Share

Manufacturer

Jan 2021 Forecast

Jan 2020 Actual

Dec 2020 Actual

BMW

1.8%

1.9%

2.8%

Daimler

1.5%

2.1%

2.2%

Ford

13.6%

13.7%

12.8%

GM

19.0%

18.2%

18.2%

Honda

8.2%

8.9%

8.4%

Hyundai

3.9%

3.9%

4.3%

Kia

3.4%

3.5%

3.3%

Nissan

6.4%

7.1%

6.1%

Stellantis

11.9%

11.8%

12.5%

Subaru

3.9%

4.0%

3.9%

Tesla

2.5%

2.0%

1.7%

Toyota

16.2%

14.6%

15.5%

Volkswagen Group

3.8%

4.0%

4.3%

Retail Market Share

Manufacturer

Jan 2021 Forecast

Jan 2020 Actual

Dec 2020 Actual

BMW

2.0%

2.1%

3.1%

Daimler

1.7%

2.5%

2.4%

Ford

12.6%

11.7%

11.8%

GM

17.1%

16.2%

17.9%

Honda

9.7%

11.0%

9.5%

Hyundai

4.1%

4.0%

4.2%

Kia

3.7%

3.7%

3.6%

Nissan

6.0%

6.3%

5.6%

Stellantis

11.1%

11.0%

11.6%

Subaru

4.4%

4.8%

4.3%

Tesla

3.0%

2.4%

1.9%

Toyota

16.4%

15.4%

15.5%

Volkswagen Group

4.3%

4.4%

4.8%

Average Transaction Price (ATP)

Manufacturer

Jan 2021 Forecast

Jan 2020 Actual

Dec 2020 Actual

YOY

MOM

BMW

$58,473

$57,090

$59,710

2.4%

-2.1%

Daimler

$61,867

$60,853

$61,087

1.7%

1.3%

Ford

$43,580

$42,543

$44,354

2.4%

-1.7%

GM

$41,852

$39,522

$43,735

5.9%

-4.3%

Honda

$30,740

$29,220

$30,959

5.2%

-0.7%

Hyundai

$31,273

$28,324

$30,477

10.4%

2.6%

Kia

$28,204

$25,647

$28,137

10.0%

0.2%

Nissan

$30,068

$29,351

$29,965

2.4%

0.3%

Stellantis

$42,886

$40,590

$43,259

5.7%

-0.9%

Subaru

$30,564

$30,032

$30,789

1.8%

-0.7%

Toyota

$34,995

$33,379

$35,321

4.8%

-0.9%

Volkswagen Group

$43,040

$40,787

$42,920

5.5%

0.3%

Industry

$37,330

$35,821

$39,089

4.2%

-4.5%

Incentive Spending

Manufacturer

Jan 2021 Forecast

Jan 2020 Actual

Dec 2020 Actual

YOY

MOM

BMW

$4,687

$5,812

$5,233

-19.4%

-10.4%

Daimler

$4,187

$6,246

$4,438

-33.0%

-5.7%

Ford

$3,925

$4,926

$4,464

-20.3%

-12.1%

GM

$5,537

$5,673

$4,971

-2.4%

11.4%

Honda

$2,862

$2,520

$2,455

13.6%

16.6%

Hyundai

$2,281

$3,092

$2,536

-26.2%

-10.0%

Kia

$2,605

$3,686

$2,999

-29.3%

-13.1%

Nissan

$4,062

$4,842

$4,586

-16.1%

-11.4%

Stellantis

$5,284

$5,027

$4,681

5.1%

12.9%

Subaru

$1,512

$1,244

$1,505

21.5%

0.5%

Toyota

$2,466

$2,679

$2,755

-8.0%

-10.5%

Volkswagen Group

$3,754

$4,407

$4,256

-14.8%

-11.8%

Industry

$3,839

$4,151

$3,869

-7.5%

-0.8%

Incentives as a Percentage of Average Transaction Price (ATP)

Manufacturer

Jan 2021 Forecast

Jan 2020 Actual

Dec 2020 Actual

YOY

MOM

BMW

8.0%

10.2%

8.8%

-21.3%

-8.5%

Daimler

6.8%

10.3%

7.3%

-34.1%

-6.8%

Ford

9.0%

11.6%

10.1%

-22.2%

-10.5%

GM

13.2%

14.4%

11.4%

-7.8%

16.4%

Honda

9.3%

8.6%

7.9%

8.0%

17.4%

Hyundai

7.3%

10.9%

8.3%

-33.2%

-12.3%

Kia

9.2%

14.4%

10.7%

-35.7%

-13.3%

Nissan

13.5%

16.5%

15.3%

-18.1%

-11.7%

Stellantis

12.3%

12.4%

10.8%

-0.5%

13.9%

Subaru

4.9%

4.1%

4.9%

19.4%

1.2%

Toyota

7.0%

8.0%

7.8%

-12.2%

-9.7%

Volkswagen Group

8.7%

10.8%

9.9%

-19.3%

-12.0%

Industry

10.3%

11.6%

9.9%

-11.2%

3.9%

(Note: This forecast is based solely on TrueCar, Inc.’s analysis of industry sales trends and conditions and is not a projection of TrueCar, Inc.’s operations.)

About TrueCar
TrueCar is a leading automotive digital marketplace that enables car buyers to connect to our nationwide network of Certified Dealers. We are building the industry’s most personalized and efficient car buying experience as we seek to bring more of the purchasing process online. Consumers who visit our marketplace will find a suite of vehicle discovery tools, price ratings, and market context on new and used cars – all with a clear view of what’s a great deal. When they are ready, TrueCar will enable them to connect with a local Certified Dealer who shares in our belief that truth, transparency, and fairness are the foundation of a great car buying experience. As part of our marketplace, TrueCar powers car-buying programs for over 250 leading brands, including AARP, Sam’s Club, and American Express. Nearly half of all new-car buyers engage with TrueCar powered sites, where they buy smarter and drive happier. TrueCar is headquartered in Santa Monica, California, with offices in Austin, Texas, and Boston, Massachusetts.

For more information, please visit www.truecar.com, and follow us on Facebook or Twitter. TrueCar media line: +1-844-469-8442 (US toll-free) | Email: pr@truecar.com 

TrueCar PR Contacts:
Shadee Malekafzali
shadee@truecar.com
424.258.8694

Tanya Kohan
tkohan@truecar.com
714.425.6319

Cision View original content to download multimedia:http://www.prnewswire.com/news-releases/truecar-forecasts-new-and-used-retail-sales-up-slightly-year-over-year-for-january-2021-while-fleet-recovery-drags-301214612.html

SOURCE Truecar, Inc.

Black and Hispanic Americans on the U.S. financial system: «The odds were always against me,» new Credit Sesame survey finds

SAN FRANCISCO, Jan. 26, 2021 /PRNewswire/ — Black and Hispanic Americans are being hit harder by the credit system, a recent survey from Credit Sesame finds. With poor credit impacting more than just one’s financial picture—it can affect everything from a consumer’s mental health to their ability to get a car loan…

SAN FRANCISCO, Jan. 26, 2021 /PRNewswire/ — Black and Hispanic Americans are being hit harder by the credit system, a recent survey from Credit Sesame finds. With poor credit impacting more than just one’s financial picture—it can affect everything from a consumer’s mental health to their ability to get a car loan or lease a cell phone—this racial credit gap comes at a high cost.  

According to the research, which surveyed 5,000 adults in the United States, Black Americans report having the lowest overall credit scores of the groups surveyed. More than half (54 percent) of Black Americans report having poor or fair credit (a credit score below 640) or no credit at all, while 41 percent of Hispanic Americans, 37 percent of White Americans and 18 percent of Asian Americans fall into this category.

Black Americans are also at a disadvantage when it comes to financial products, savings and debt. Over half (53 percent) of Black Americans say they are living paycheck to paycheck, significantly higher than 44 percent of Americans overall, and many more Black Americans (21 percent) say they have student loans compared to the rate among all Americans (13 percent). Just 53 percent of Black Americans report having a credit card—a critical component for helping to build a strong credit foundation when used correctly—compared to 63 percent of Hispanic Americans, 67 percent of White Americans, and 79 percent of Asian Americans.

«I was never taught [about finances] growing up,» said a Black American survey respondent. «I was told investing was only what rich people could do.»

Asian Americans, in contrast, say they are thriving in the credit system. More than 80 percent of Asian Americans have a good or excellent credit score (a credit score above 640), significantly higher than the national average of 61 percent. Additionally, 92 percent of this group reported having a positive or neutral experience with their credit.

«While the credit system was created to be blind, this data shows that Black and Hispanic Americans are being unfairly shut out of the system,» said Jay Moon, General Manager of Credit at Credit Sesame. «We’ve seen that the cost of poor credit is much more than financial, impacting everything from mental health to relationships. It’s unacceptable that this is affecting the lives of some more than others.»

The credit score itself is only part of the story—many feel like they are inherently at a disadvantage within the credit system. Hispanic Americans feel nearly as slighted by the system as Black Americans. Nearly a third of Black Americans (30 percent) and a quarter of Hispanic Americans (25 percent) say they never had a chance to build good credit and that the system was stacked against them from the beginning. Further:

  • Thirty percent of Black Americans and 27 percent of Hispanic Americans say they were misinformed or tricked in their first interactions with credit, compared to 18 percent among White Americans and 15 percent among Asian Americans.
  • Twenty-one percent of Black Americans, 17 percent of Hispanic Americans and 16 percent of White Americans say financial services exist to hurt them, significantly higher than Asian Americans (9 percent).
  • Nearly 1 in 3 Black and Hispanic Americans (30 percent) say there aren’t fair credit options for people like them, significantly higher than among White Americans (26 percent) and Asian Americans (23 percent).
  • Over a third of Black Americans (34 percent) and Hispanic Americans (32 percent) are fearful and uncertain about the future because of their credit score compared to 27 percent White Americans and 20 percent Asian Americans.

One survey respondent said: «As an African American person, I feel that the odds were always against me. Banks won’t give us loans, etc.» A Hispanic American survey respondent added: «I was misinformed about credit and the way that it works. The odds were never in my favor from the beginning.»

«Creating equal credit opportunity is a critical first step toward helping to close the racial gap in our society, and it’s promising to see so many fintechs recognize this,» said Moon. «Whether it’s creating products explicitly for these underserved groups or providing more ways to access credit and resources, the important thing is to make progress.»

Methodology
Credit Sesame conducted this research using an online survey prepared by Method Research and distributed by Dynata among n=5,000 adults in the United States. The sample was balanced by census targets for age, gender and ethnicity to be nationally representative of the US population. Data was collected from October 16 to October 30, 2020. 

About Credit Sesame
Credit Sesame’s mission is to help consumers work toward financial stability and ultimately create better opportunities for themselves and their families. Strong credit health is inextricably linked to financial health and stability, and with the launch of Sesame Cash, Credit Sesame will help consumers manage both. Credit Sesame has helped millions of consumers improve their credit scores, increase their approval odds, lower the cost of credit and save money. Credit Sesame is funded by leading venture capital firms and strategic investors, including Menlo Ventures, Inventus Capital, Globespan Capital, IA Capital Groups, NortonLifeLock, Capital One Ventures, and Stanford University, among others. Credit Sesame currently operates in the U.S. and Canada. For more information on Credit Sesame, visit www.creditsesame.com and follow on Facebook, Twitter and LinkedIn.


Cision View original content to download multimedia:http://www.prnewswire.com/news-releases/black-and-hispanic-americans-on-the-us-financial-system-the-odds-were-always-against-me-new-credit-sesame-survey-finds-301215072.html

SOURCE Credit Sesame

«Go Green with Suburban Propane» Logo Registered with United States Patent and Trademark Office (USPTO)

WHIPPANY, N.J., Jan. 26, 2021 /PRNewswire/ — Suburban Propane Partners, L.P. (NYSE: SPH), a national distributor of propane, renewable propane, and related products and services, as well as an investor in low carbon fuel alternatives, has registered its «Go Green with Suburban Propane» logo with the United States Patent and Trademark Office (USPTO). The trademark registration provides Suburban Propane with the exclusive right to use the trademark…

WHIPPANY, N.J., Jan. 26, 2021 /PRNewswire/ — Suburban Propane Partners, L.P. (NYSE: SPH), a national distributor of propane, renewable propane, and related products and services, as well as an investor in low carbon fuel alternatives, has registered its «Go Green with Suburban Propane» logo with the United States Patent and Trademark Office (USPTO). The trademark registration provides Suburban Propane with the exclusive right to use the trademark with the various goods and services covered by the registration that pertain to its green initiative, including in connection with flyers and newsletters related to the benefits of propane usage and green architecture, and a website featuring energy efficiency information about those same topics.

The «Go Green with Suburban Propane« initiative focuses on the company’s commitment to advocating for the clean burning attributes of propane in the transition to a sustainable energy future and to investing in innovative solutions to pave the way to zero-carbon emissions. When compared to gasoline and diesel, propane and renewable propane can significantly reduce the harmful contributors to greenhouse gases. Renewable propane possesses lower carbon intensity than traditional propane, with no change in performance and handling.

«As one of the leading distributors of propane in the United States, we are committed to educating our customers, legislators and other key stakeholders on the benefits of propane in meeting aggressive carbon reduction targets,» said Nandini Sankara, Spokesperson, Suburban Propane. «With our ‘Go Green with Suburban Propane’ logo officially registered, this further solidifies our commitment to pioneer a cleaner, more sustainable energy future through innovation, technology, and key investments.»

As part of the green initiatives, Suburban Propane has: partnered with U-Haul® to provide eco-friendly, renewable propane in California; purchased a 39% equity stake in Oberon Fuels, Inc., a development-stage producer of low carbon, renewable Dimethyl Ether (rDME) transportation fuel, which is focused on the research and development of a practical and affordable pathway to zero-emission transportation through its proprietary production process; and continued to commit itself to innovation and making investments to bring an even cleaner version of propane to the market.

About Suburban Propane

Suburban Propane Partners, L.P. (NYSE:SPH), is a nationwide distributor of propane, renewable propane, and related products and services, as well as an investor in low carbon fuel alternatives, as well as a marketer of natural gas and electricity, servicing over 1 million customers through its 700 locations across 41 states. The company proudly celebrated 90 years of innovation, growth and quality service in 2018. The brand is currently focused on three core elements including Suburban Commitment – showcasing the company’s 90+ year legacy of flexibility, reliability and dependability, Suburban Cares – highlighting dedication to serving local communities across the nation and Go Green with Suburban Propane – promoting the affordable, clean burning and versatile nature of propane as a bridge to a green energy future. Suburban Propane is a New York Stock Exchange listed limited partnership headquartered in Whippany, NJ. For additional information on Suburban Propane, please visit http://www.suburbanpropane.com/.  

Cision View original content to download multimedia:http://www.prnewswire.com/news-releases/go-green-with-suburban-propane-logo-registered-with-united-states-patent-and-trademark-office-uspto-301214979.html

SOURCE Suburban Propane Partners, L.P.

Clarity Movement Co. Selected by Greater London Authority to Power New Air Quality Monitoring Network in the Fight Against Toxic Air

BERKELEY, Calif., Jan. 26, 2021 /PRNewswire-PRWeb/ — Clarity Movement Co., a global sensing and data analytics company empowering the world to reduce air pollution, shared today that its <a target="_blank"…

BERKELEY, Calif., Jan. 26, 2021 /PRNewswire-PRWeb/ — Clarity Movement Co., a global sensing and data analytics company empowering the world to reduce air pollution, shared today that its air quality monitoring technology was selected to power the next phase of the Breathe London project. The selection comes through a partnership with Imperial College London, a pioneering university with a research arm specializing in air pollution that is responsible for managing the London Air Quality Network (LAQN), one of the densest and most advanced metropolitan monitoring networks in the world.

Deputy Mayor for Environment and Energy, Shirley Rodrigues said, «This is a major milestone for the Mayor’s world-leading Breathe London sensor network. Giving Londoners the opportunity to see the levels of pollution in their local area will improve awareness and help people reduce their exposure. It will also help City Hall, TfL [Transport for London], and the boroughs better target efforts on improving air quality and contributing to a green recovery from the coronavirus pandemic. We hope the success of this scheme and its innovative use of clean technology will act as a blueprint for cities around the world to battle their own toxic air emergencies.»

Clarity’s technology will be used in the fight against London’s toxic air, giving local communities access to affordable and reliable air quality data at scale. Initially, more than 100 low-cost air quality sensors will be installed at London hospitals, schools, and other sensitive locations to complement London’s existing high-quality reference-grade monitors and to enable real-time measurement of ambient air pollution at the neighborhood level.

«Air pollution is often described as an invisible killer. To optimize solutions it is imperative local communities are empowered with actionable data in real-time,» said Dr. Gary Fuller, air pollution scientist, Imperial College London. «The Breathe London project makes London the first city to holistically integrate low-cost sensors with existing air quality infrastructure. We are excited to be partnering with Clarity who will provide hardware and software to measure local air quality that is significantly lower cost and far easier to deploy than traditional equipment. A key strength of the Breathe London project will be at our new data centre, at White City in west London, where traditional and new lower-cost sensor data will be combined to provide Londoners with some of the highest-resolution air quality data in the world.»

Breathe London is funded by the Mayor of London and supported by Bloomberg Philanthropies. Installation of the new network of Clarity air sensors will be completed in tranches starting in January 2021, with full deployment of the publicly-funded sensors expected by June 2021. The network will continue to expand through community funding initiatives, coordinated by Imperial College London.

«We are proud to partner with Breathe London to offer affordable air monitoring technology to London communities, and we are confident that this project represents a blueprint for governments across the globe who are working to pursue their own sustainability initiatives amidst rising air pollution and ongoing budget challenges,» said Meiling Gao, COO, Clarity Movement Co. «Clarity can be the technology partner to help governments worldwide push forward despite budgetary constraints and deploy modern air quality monitoring networks that serve and empower the local community.»

Air Quality Monitoring 2.0: The Future of Air Quality Monitoring Networks
In the United States, the legacy infrastructure traditionally used to measure and manage air quality is timeworn and costly to maintain. The U.S. Government Accountability Office (GAO), for example, released a report in December 2020 highlighting that US air pollution monitoring networks have fallen into disrepair due to aging equipment and budgetary constraints.

The U.S. isn’t the only country challenged to maintain funding for air quality monitoring infrastructure – government-funded air pollution initiatives are chronically underfunded globally. Grants from multilateral agencies, such as the World Bank and the United Nations Development Programme, remain critical to building air quality monitoring efforts in the many countries where no funding exists. As government agencies across the world face budget cuts due to the economic impacts of COVID-19 in the coming years, air quality leaders will need to find ways to stretch their monitoring budgets.

«Air pollution and climate change conditions are reaching criticality worldwide at the same time that environmental agencies face budget constraints, and traditional air sensing technologies have reached a crossroads,» Gao also said. «Given the current conditions, we believe that the future of air quality monitoring networks, Air Quality Monitoring 2.0, will consist of installing low-cost and highly-scalable sensors to complement existing regulatory monitoring equipment and fill in the spatial and temporal gaps that exist with the traditional networks. These technologically advanced sensors are significantly less expensive than traditional technologies and will be key to making air quality monitoring globally accessible by removing the steep up-front and operational costs that come with traditional monitoring networks.»

Helping governments in more than 85 cities across more than 50 countries adopt Air Quality Monitoring 2.0, Clarity offers a reliable, low-cost air quality management solution that is purpose-built to complement existing regulatory monitoring networks. Solar-powered and weatherproof, the Clarity Node-S weighs just 1.2 kg and measures air pollutants like fine particulate matter and nitrogen dioxide. Clarity’s monitors can be easily deployed in 10 minutes or less and link to the cloud through native cellular connectivity, allowing them to operate seamlessly with minimal maintenance in any environmental condition.

Once installed, customers have direct access to the data collected through API access and the Clarity Dashboard, an intuitive software platform that visualizes and integrates data from existing reference stations and includes advanced features like colocation analysis. The company upholds the highest standards for data and security and ensures that customers retain ownership of all data collected by their Clarity network. Clarity’s sensing-as-a-service model includes a hardware warranty and access to a dedicated customer success team of air quality experts for project and technical support.

To support other cities and government agencies looking to leverage low-cost sensors to expand air quality monitoring coverage in the face of budget cuts, Clarity released a playbook titled «Maximize Your Air Quality Budget in a Post-COVID World: A Guide to Leveraging Low-cost Sensors for Air Quality Monitoring 2.0». To download the playbook, visit Clarity’s website.

About Clarity Movement Co.
Clarity Movement Co. was founded in 2014 to empower the world to reduce air pollution. The Clarity team leverages expertise in air sensing technology, IoT devices, and data analytics to provide the most reliable low-cost hardware and software air quality monitoring solution available on the market. Clarity’s air quality sensing-as-a-service solution revolutionizes the way governments, businesses, and communities understand and respond to air pollution, and currently provides local, accurate, and scalable air quality monitoring to more than 85 cities across 50+ countries. For more information, please visit clarity.io or follow us on Facebook, YouTube, Twitter, and LinkedIn.

About Imperial College of London
Imperial College London is one of the world’s leading universities. The College’s 17,000 students and 8,000 staff are expanding the frontiers of knowledge in science, medicine, engineering and business, and translating their discoveries into benefits for our society. Imperial is the UK’s most international university, according to Times Higher Education, with academic ties to more than 150 countries. Reuters named the College as the UK’s most innovative university because of its exceptional entrepreneurial culture and ties to industry.

The Environmental Research Group, part of Imperial’s School of Public Health, is a leading provider of air quality information and research in the UK, combining air pollution science, toxicology and epidemiology to determine the impacts of air pollution on health and the causal factors.

About Greater London Authority
The Greater London Authority (GLA) is the strategic authority for London and includes the Mayor of London’s office. Under the Greater London Authority Act 1999 the elected Mayor of London has legal responsibility for preparing an Air Quality Strategy for London and leads on the implementation of measures in the city to tackle pollution emissions, reduce exposure, raise awareness and integrate air quality and public health. Further background on what the GLA does can be found on the GLA website here: https://www.london.gov.uk/about-us/how-we-work-london

Media Contact

Christina Dela Cruz, ARPR on behalf of Clarity, 8553008209, christina@arpr.com


SOURCE ARPR on behalf of Clarity