Toyota Motor North America informa las ventas de fin de año, diciembre 2020

— Toyota es la marca minorista número uno por 9.° año consecutivo

— Fabricante de vehículos alternativos número uno en ventas por 21.° año consecutivo

— Las ventas totales de híbridos en 2020 aumentaron casi un 23 %; las ventas de híbridos de la división Toyota se duplicaron

— El Camry es el automóvil de pasajeros más vendido en los EE. UU. por 19.° año consecutivo

— El RAV4 es el SUV más vendido en los EE. UU. por 4.° año consecutivo

— La Tacoma es la camioneta pequeña más vendida por 16.° año…

— Toyota es la marca minorista número uno por 9.° año consecutivo

— Fabricante de vehículos alternativos número uno en ventas por 21.° año consecutivo

— Las ventas totales de híbridos en 2020 aumentaron casi un 23 %; las ventas de híbridos de la división Toyota se duplicaron

— El Camry es el automóvil de pasajeros más vendido en los EE. UU. por 19.° año consecutivo

— El RAV4 es el SUV más vendido en los EE. UU. por 4.° año consecutivo

— La Tacoma es la camioneta pequeña más vendida por 16.° año consecutivo

— El Lexus GX registra un aumento de ventas anuales de casi el 10 por ciento

PLANO, Texas, 6 de enero de 2021 /PRNewswire-HISPANIC PR WIRE/ — Toyota Motor North America (TMNA) informó hoy ventas de 249,601 vehículos en diciembre de 2020, un aumento del 20.4 por ciento en volumen y del 7.5 por ciento en la tasa de venta diaria (DSR) en comparación con diciembre de 2019.

Para el año calendario 2020, TMNA informó ventas de 2,112,941 vehículos, una disminución del 11.3 por ciento en volumen y una disminución del 11.9 por ciento en la tasa de venta diaria.

La división Toyota informó ventas de 211,378 vehículos en diciembre, un aumento del 22.9 por ciento en volumen y del 9.7 por ciento en la tasa de venta diaria.  Para el año, Toyota informó ventas de 1,837,900 vehículos, una disminución del 11.9 en volumen y del 12.4 por ciento en la tasa de venta diaria.

La división Lexus informó ventas de 38,223 vehículos en diciembre, un aumento del 8.2 en volumen y una disminución del 3.4 por ciento en la tasa de venta diaria.  Para el año, Lexus informó ventas de 275,041 vehículos, una disminución del 7.7 por ciento en volumen y del 8.3 por ciento en la tasa de venta diaria.

Aspectos destacados de diciembre 2020 y fin de año

TMNA:

  • Número uno en ventas de vehículos alternativos (híbridos, vehículos eléctricos, vehículos con celdas de combustible) durante 21 años consecutivos
  • Las ventas de híbridos ascendieron a 50,649 vehículos en diciembre, un aumento del 82.8 por ciento
  • Las ventas de híbridos ascendieron a 337,036 vehículos en 2020, un aumento del 22.7 por ciento
  • Las ventas de híbridos representaron casi el 16 por ciento del volumen de venta de TMNA en 2020
  • Con la incorporación de los nuevos modelos Sienna, Venza y Mirai, TMNA ahora ofrece 14 vehículos híbridos, eléctricos y con celdas de combustible en su cartera

División Toyota:

  • Marca minorista número uno por 9.o año consecutivo
  • Las ventas de híbridos de la división se duplicaron en diciembre; un aumento del 26.7 por ciento en 2020
  • El Camry es el automóvil de pasajeros más vendido en los EE. UU. por 19.o año consecutivo
  • El RAV4 es el SUV más vendido en los EE. UU. por 4.o año consecutivo
  • La Tacoma es la camioneta pequeña más vendida por 16.o año consecutivo; las ventas de diciembre aumentaron un 39.7 por ciento
  • Las ventas de la Sienna aumentaron un 45.2 por ciento en diciembre
  • Las ventas de camionetas aumentaron un 39.5 por ciento en diciembre
  • Las ventas de la Tundra aumentaron un 39.1 por ciento en diciembre
  • Las ventas de SUV aumentaron un 28.5 por ciento en diciembre
  • El mejor diciembre: ventas de vehículos ligeros de la división, ventas de híbridos de la división, ventas de camiones ligeros de la división, ventas totales de Highlander, ventas totales de Rav4, Highlander híbrido, Corolla híbrido, Tacoma, 4Runner
  • El mejor mes: Tacoma, 4Runner, Highlander híbrido, RAV4 Prime, Corolla híbrido, ventas totales de híbridos, ventas totales de camiones ligeros

División Lexus:

  • Con ventas de 38,223 vehículos, diciembre fue el mejor mes de 2020 en ventas
  • Vehículos utilitarios de lujo (LUV): con ventas de 29,578 vehículos, diciembre fue el mejor mes en ventas hasta el momento
  • Las ventas de automóviles de pasajeros aumentaron un 14 por ciento en diciembre, por lo que este se convirtió en el mejor mes en ventas de 2020
  • Con ventas de 5,730 vehículos híbridos, diciembre fue el mejor mes en ventas de esta categoría hasta el momento
  • Las ventas totales de híbridos de la división Lexus aumentaron casi un 2 por ciento en 2020
  • Gracias a las ventas del UX y el UX híbrido, 2020 fue el mejor año en ventas
  • Diciembre fue el mes de mejores ventas de 2020: RX total, NX total, GX, LX, IS, ES, LC, UX

Nota: A menos que se indique lo contrario, todas las cifras reflejan el volumen de ventas en bruto no ajustado

Acerca de Toyota

Toyota (NYSE:TM) ha sido parte del tejido cultural de los Estados Unidos durante más de 60 años y está comprometida con el desarrollo de la movilidad sostenible de última generación a través de sus marcas Toyota y Lexus, además de sus casi 1,500 concesionarios. 

Toyota ha creado una enorme cadena de valor y emplea directamente a más de 36,000 personas en los EE. UU. La compañía ha contribuido con el diseño, la ingeniería y el ensamblaje de clase mundial de más de 30 millones de automóviles y camiones en nuestras 9 plantas de fabricación, que para 2021 serán 10 , cuando entre en operación su empresa conjunta de producción en Alabama.

Para ayudar a inspirar a la próxima generación a seguir una carrera en campos basados en STEM, incluido el de la movilidad, Toyota lanzó su centro de educación virtual en www.TourToyota.com  con una experiencia de inmersión y la oportunidad de visitar muchas de nuestras instalaciones de fabricación en los EE. UU. El centro también incluye una serie de lecciones y planes de estudio gratuitos basados en STEM a través de los socios de la Fundación Toyota de los EE. UU., excursiones virtuales y mucho más. Para obtener más información acerca de Toyota, visite  www.toyotanewsroom.com .

Contacto:
Victor Vanov
victor.vanov@toyota.com 
469.292.1318


RESUMEN DE VENTAS DE TOYOTA EN LOS ESTADOS UNIDOS

Diciembre de 2020

— MES EN CURSO —

— AÑO CALENDARIO A LA FECHA —     

2020

2019

DSR %

VOL %

2020

2019

DSR %

VOL %

TOTAL TMNA

249,601

207,373

7.5

20.4

2,112,941

2,383,349

-11.9

-11.3

TOTAL DIV. TOYOTA

211,378

172,048

9.7

22.9

1,837,900

2,085,235

-12.4

-11.9

TOTAL LEXUS

38,223

35,325

-3.4

8.2

275,041

298,114

-8.3

-7.7

YARIS

141

932

-86.5

-84.9

6,437

21,916

-70.8

-70.6

COROLLA

25,409

23,742

-4.4

7.0

237,178

304,850

-22.7

-22.2

SUPRA

704

404

55.6

74.3

5,887

2,884

102.8

104.1

86 (INCL. FR-S)

205

276

-33.7

-25.7

2,476

3,398

-27.6

-27.1

MIRAI

20

66

-72.9

-69.7

499

1,502

-67.0

-66.8

AVALON

1,913

1,844

-7.4

3.7

18,421

27,767

-34.1

-33.7

PRIUS

4,078

6,058

-39.9

-32.7

43,525

69,718

-38.0

-37.6

CAMRY

30,364

26,309

3.0

15.4

294,348

336,978

-13.2

-12.7

TOTAL AUTOMÓVILES DIV. TOYOTA

62,834

59,632

-5.9

5.4

608,771

769,014

-21.3

-20.8

IS

2,289

1,171

74.5

95.5

13,600

14,920

-9.4

-8.8

RC

416

428

-13.2

-2.8

3,808

4,591

-17.6

-17.1

ES

5,101

5,025

-9.4

1.5

43,292

51,336

-16.2

-15.7

GS

85

265

-71.4

-67.9

2,560

3,378

-24.7

-24.2

LS

524

583

-19.8

-10.1

3,617

5,528

-35.0

-34.6

LC

230

114

80.1

101.8

1,325

1,219

8.0

8.7

TOTAL AUTOMÓVILES LEXUS

8,645

7,586

1.7

14.0

68,205

80,975

-16.3

-15.8

TOTAL AUTOMÓVILES TMNA

71,479

67,218

-5.1

6.3

676,976

849,989

-20.9

-20.4

SIENNA

7,513

5,176

29.6

45.2

42,885

73,585

-42.1

-41.7

C-HR

3,308

3,303

-10.6

0.2

42,936

48,930

-12.8

-12.3

RAV4

46,846

41,282

1.3

13.5

430,387

448,071

-4.6

-3.9

VENZA

4,495

0

0

0

13,073

9

0

0

HIGHLANDER

26,778

20,449

16.9

31.0

212,276

239,438

-11.9

-11.3

4RUNNER

16,869

11,529

30.6

46.3

129,052

131,888

-2.8

-2.2

SEQUOIA

1,048

876

6.8

19.6

7,364

10,289

-28.9

-28.4

LAND CRUISER

606

360

50.3

68.3

3,147

3,536

-11.6

-11.0

TOTAL SUV DIV. TOYOTA

99,950

77,799

14.7

28.5

838,235

882,162

-5.6

-5.0

TACOMA

28,957

20,727

24.7

39.7

238,806

248,801

-4.6

-4.0

TUNDRA

12,124

8,714

24.2

39.1

109,203

111,673

-2.8

-2.2

TOTAL CAMIONETAS DIV. TOYOTA

41,081

29,441

24.6

39.5

348,009

360,474

-4.1

-3.5

TOTAL CAMIONES DIV. TOYOTA

148,544

112,416

18.0

32.1

1,229,129

1,316,221

-7.2

-6.6

UX

1,848

1,933

-14.6

-4.4

16,962

16,725

0.8

1.4

NX

8,256

7,955

-7.3

3.8

55,784

58,715

-5.6

-5.0

RX

14,514

14,069

-7.9

3.2

101,059

111,036

-9.6

-9.0

GX

4,139

3,220

14.8

28.5

28,519

25,945

9.2

9.9

LX

821

562

30.4

46.1

4,512

4,718

-5.0

-4.4

TOTAL CAMIONES LEXUS

29,578

27,739

-4.8

6.6

206,836

217,139

-5.4

-4.7

TOTAL CAMIONES TMNA

178,122

140,155

13.5

27.1

1,435,965

1,533,360

-7.0

-6.4

Días de ventas

28

25

309

307

DSR = Tasa de ventas diarias

*Vehículos fabricados en Norteamérica 

RESUMEN DE VENTAS DE TOYOTA EN LOS ESTADOS UNIDOS

Diciembre de 2020

— MES EN CURSO —

— AÑO CALENDARIO A LA FECHA —

2020

2019

DSR %

VOL %

2020

2019

DSR %

VOL %

COROLLA

12,192

13,451

-19.1

-9.4

116,915

154,355

-24.7

-24.3

CAMRY

30,364

26,308

3.1

15.4

294,342

336,392

-13.1

-12.5

AVALON

1,913

1,844

-7.4

3.7

18,421

27,767

-34.1

-33.7

YARIS SD (INCL. YARIS IA)

72

241

-73.3

-70.1

2,454

19,730

-87.6

-87.6

YARIS HB

69

685

-91.0

-89.9

3,953

1,817

116.1

117.6

RAV4

39,336

30,148

16.5

30.5

322,908

256,458

25.1

25.9

HIGHLANDER

26,778

20,449

16.9

31.0

212,276

239,437

-11.9

-11.3

SIENNA

7,513

5,176

29.6

45.2

42,885

73,585

-42.1

-41.7

SEQUOIA

1,048

876

6.8

19.6

7,364

10,289

-28.9

-28.4

TACOMA

28,957

20,727

24.7

39.7

238,806

248,801

-4.6

-4.0

TUNDRA

12,124

8,714

24.2

39.1

109,203

111,673

-2.8

-2.2

ES

5,077

4,824

-6.0

5.2

42,961

45,099

-5.4

-4.7

RX

11,235

12,260

-18.2

-8.4

86,584

94,210

-8.7

-8.1

TOTAL

176,678

145,703

8.3

21.3

1,499,072

1,619,622

-8.0

-7.4

% VEHÍCULOS DE NORTEAMÉRICA DEL TOTAL

70.8%

70.3%

70.9%

68.0%

AUTOMÓVILES IMPORTADOS DIV. TOYOTA

18,224

17,103

-4.9

6.6

172,686

228,953

-25.1

-24.6

AUTOMÓVILES IMPORTADOS LEXUS

3,568

2,762

15.3

29.2

25,244

35,876

-30.1

-29.6

AUTOMÓVILES FABRICADOS EN NORTEAMÉRICA DIV. TOYOTA

44,610

42,529

-6.3

4.9

436,085

540,061

-19.8

-19.3

AUTOMÓVILES FABRICADOS EN NORTEAMÉRICA LEXUS

5,077

4,824

-6.0

5.2

42,961

45,099

-5.4

-4.7

TOTAL AUTOMÓVILES TMNA

71,479

67,218

-5.1

6.3

676,976

849,989

-20.9

-20.4

CAMIONES IMPORTADOS DIV. TOYOTA

32,788

26,326

11.2

24.5

295,687

375,969

-21.9

-21.4

CAMIONES IMPORTADOS LEXUS

18,343

15,479

5.8

18.5

120,252

122,929

-2.8

-2.2

CAMIONES FABRICADOS EN NORTEAMÉRICA DIV. TOYOTA

115,756

86,090

20.1

34.5

933,442

940,252

-1.4

-0.7

CAMIONES FABRICADOS EN NORTEAMÉRICA LEXUS

11,235

12,260

-18.2

-8.4

86,584

94,210

-8.7

-8.1

TOTAL CAMIONES TMNA

178,122

140,155

13.5

27.1

1,435,965

1,533,360

-7.0

-6.4

Días de ventas

28

25

309

307

RESUMEN DE VENTAS DE HÍBRIDOS DE TOYOTA EN LOS ESTADOS UNIDOS

Diciembre de 2020

— MES EN CURSO —

— AÑO CALENDARIO A LA FECHA —  

2020

2019

DSR %

VOL. %

2020

2019

DSR %

VOL. %

TOYOTA PRIUS HÍBRIDO

4,078

6,058

-39.9

-32.7

43,525

69,718

-38.0

-37.6

TOYOTA COROLLA HÍBRIDO

2,436

1,545

40.8

57.7

17,628

16,301

7.4

8.1

TOYOTA CAMRY HÍBRIDO

4,600

2,247

82.8

104.7

33,826

26,043

29.0

29.9

TOYOTA AVALON HÍBRIDO

753

571

17.7

31.9

6,714

6,552

1.8

2.5

TOYOTA MIRAI

20

66

-72.9

-69.7

499

1,502

-67.0

-66.8

TOYOTA SIENNA HÍBRIDO

6,909

0

0

0

9,690

0

0

0

TOYOTA HIGHLANDER HÍBRIDO

9,454

1,796

370.0

426.4

48,455

18,248

163.8

165.5

TOYOTA RAV4 HÍBRIDO

11,104

10,127

-2.1

9.7

115,974

92,525

24.5

25.3

TOYOTA RAV4 PRIME

1,070

0

0

0

3,200

0

0

0

TOYOTA VENZA HÍBRIDO

4,495

0

0

0

13,073

0

0

0

LEXUS ES HÍBRIDO

1,138

1,054

-3.6

8.0

8,784

9,073

-3.8

-3.2

LEXUS GS HÍBRIDO

0

0

0

0

1

7

-85.8

-85.7

LEXUS UX HÍBRIDO

1,370

1,089

12.3

25.8

11,818

8,603

36.5

37.4

LEXUS NX HÍBRIDO

1,434

1,230

4.1

16.6

9,358

9,651

-3.7

-3.0

LEXUS RX HÍBRIDO

1,786

1,907

-16.4

-6.3

14,411

16,116

-11.2

-10.6

LEXUS LS HÍBRIDO

0

20

-100

-100

66

187

-64.9

-64.7

LEXUS LC HÍBRIDO

2

3

-40.5

-33.3

14

37

-62.4

-62.2

TOTAL HÍBRIDOS TMNA

50,649

27,713

63.2

82.8

337,036

274,572

22.0

22.7

TOTAL HÍBRIDOS TOYOTA

44,919

22,410

79.0

100.4

292,584

230,898

25.9

26.7

TOTAL HÍBRIDOS LEXUS

5,730

5,303

-3.5

8.1

44,452

43,674

1.1

1.8


Logotipo: https://mma.prnewswire.com/media/439685/Toyota_Corp_Red_Logo.jpg


FUENTE Toyota Motor North America

Toyota Motor North America informa las ventas de fin de año, diciembre 2020

— Toyota es la marca minorista número uno por 9.° año consecutivo

— Fabricante de vehículos alternativos número uno en ventas por 21.° año consecutivo

— Las ventas totales de híbridos en 2020 aumentaron casi un 23 %; las ventas de híbridos de la división Toyota se duplicaron

— El Camry es el automóvil de pasajeros más vendido en los EE. UU. por 19.° año consecutivo

— El RAV4 es el SUV más vendido en los EE. UU. por 4.° año consecutivo

— La Tacoma es la camioneta pequeña más vendida por 16.° año…

— Toyota es la marca minorista número uno por 9.° año consecutivo

— Fabricante de vehículos alternativos número uno en ventas por 21.° año consecutivo

— Las ventas totales de híbridos en 2020 aumentaron casi un 23 %; las ventas de híbridos de la división Toyota se duplicaron

— El Camry es el automóvil de pasajeros más vendido en los EE. UU. por 19.° año consecutivo

— El RAV4 es el SUV más vendido en los EE. UU. por 4.° año consecutivo

— La Tacoma es la camioneta pequeña más vendida por 16.° año consecutivo

— El Lexus GX registra un aumento de ventas anuales de casi el 10 por ciento

PLANO, Texas, 6 de enero de 2021 /PRNewswire-HISPANIC PR WIRE/ — Toyota Motor North America (TMNA) informó hoy ventas de 249,601 vehículos en diciembre de 2020, un aumento del 20.4 por ciento en volumen y del 7.5 por ciento en la tasa de venta diaria (DSR) en comparación con diciembre de 2019.

Para el año calendario 2020, TMNA informó ventas de 2,112,941 vehículos, una disminución del 11.3 por ciento en volumen y una disminución del 11.9 por ciento en la tasa de venta diaria.

La división Toyota informó ventas de 211,378 vehículos en diciembre, un aumento del 22.9 por ciento en volumen y del 9.7 por ciento en la tasa de venta diaria.  Para el año, Toyota informó ventas de 1,837,900 vehículos, una disminución del 11.9 en volumen y del 12.4 por ciento en la tasa de venta diaria.

La división Lexus informó ventas de 38,223 vehículos en diciembre, un aumento del 8.2 en volumen y una disminución del 3.4 por ciento en la tasa de venta diaria.  Para el año, Lexus informó ventas de 275,041 vehículos, una disminución del 7.7 por ciento en volumen y del 8.3 por ciento en la tasa de venta diaria.

Aspectos destacados de diciembre 2020 y fin de año

TMNA:

  • Número uno en ventas de vehículos alternativos (híbridos, vehículos eléctricos, vehículos con celdas de combustible) durante 21 años consecutivos
  • Las ventas de híbridos ascendieron a 50,649 vehículos en diciembre, un aumento del 82.8 por ciento
  • Las ventas de híbridos ascendieron a 337,036 vehículos en 2020, un aumento del 22.7 por ciento
  • Las ventas de híbridos representaron casi el 16 por ciento del volumen de venta de TMNA en 2020
  • Con la incorporación de los nuevos modelos Sienna, Venza y Mirai, TMNA ahora ofrece 14 vehículos híbridos, eléctricos y con celdas de combustible en su cartera

División Toyota:

  • Marca minorista número uno por 9.o año consecutivo
  • Las ventas de híbridos de la división se duplicaron en diciembre; un aumento del 26.7 por ciento en 2020
  • El Camry es el automóvil de pasajeros más vendido en los EE. UU. por 19.o año consecutivo
  • El RAV4 es el SUV más vendido en los EE. UU. por 4.o año consecutivo
  • La Tacoma es la camioneta pequeña más vendida por 16.o año consecutivo; las ventas de diciembre aumentaron un 39.7 por ciento
  • Las ventas de la Sienna aumentaron un 45.2 por ciento en diciembre
  • Las ventas de camionetas aumentaron un 39.5 por ciento en diciembre
  • Las ventas de la Tundra aumentaron un 39.1 por ciento en diciembre
  • Las ventas de SUV aumentaron un 28.5 por ciento en diciembre
  • El mejor diciembre: ventas de vehículos ligeros de la división, ventas de híbridos de la división, ventas de camiones ligeros de la división, ventas totales de Highlander, ventas totales de Rav4, Highlander híbrido, Corolla híbrido, Tacoma, 4Runner
  • El mejor mes: Tacoma, 4Runner, Highlander híbrido, RAV4 Prime, Corolla híbrido, ventas totales de híbridos, ventas totales de camiones ligeros

División Lexus:

  • Con ventas de 38,223 vehículos, diciembre fue el mejor mes de 2020 en ventas
  • Vehículos utilitarios de lujo (LUV): con ventas de 29,578 vehículos, diciembre fue el mejor mes en ventas hasta el momento
  • Las ventas de automóviles de pasajeros aumentaron un 14 por ciento en diciembre, por lo que este se convirtió en el mejor mes en ventas de 2020
  • Con ventas de 5,730 vehículos híbridos, diciembre fue el mejor mes en ventas de esta categoría hasta el momento
  • Las ventas totales de híbridos de la división Lexus aumentaron casi un 2 por ciento en 2020
  • Gracias a las ventas del UX y el UX híbrido, 2020 fue el mejor año en ventas
  • Diciembre fue el mes de mejores ventas de 2020: RX total, NX total, GX, LX, IS, ES, LC, UX

Nota: A menos que se indique lo contrario, todas las cifras reflejan el volumen de ventas en bruto no ajustado

Acerca de Toyota

Toyota (NYSE:TM) ha sido parte del tejido cultural de los Estados Unidos durante más de 60 años y está comprometida con el desarrollo de la movilidad sostenible de última generación a través de sus marcas Toyota y Lexus, además de sus casi 1,500 concesionarios. 

Toyota ha creado una enorme cadena de valor y emplea directamente a más de 36,000 personas en los EE. UU. La compañía ha contribuido con el diseño, la ingeniería y el ensamblaje de clase mundial de más de 30 millones de automóviles y camiones en nuestras 9 plantas de fabricación, que para 2021 serán 10 , cuando entre en operación su empresa conjunta de producción en Alabama.

Para ayudar a inspirar a la próxima generación a seguir una carrera en campos basados en STEM, incluido el de la movilidad, Toyota lanzó su centro de educación virtual en www.TourToyota.com  con una experiencia de inmersión y la oportunidad de visitar muchas de nuestras instalaciones de fabricación en los EE. UU. El centro también incluye una serie de lecciones y planes de estudio gratuitos basados en STEM a través de los socios de la Fundación Toyota de los EE. UU., excursiones virtuales y mucho más. Para obtener más información acerca de Toyota, visite  www.toyotanewsroom.com .

Contacto:
Victor Vanov
victor.vanov@toyota.com 
469.292.1318


RESUMEN DE VENTAS DE TOYOTA EN LOS ESTADOS UNIDOS

Diciembre de 2020

— MES EN CURSO —

— AÑO CALENDARIO A LA FECHA —     

2020

2019

DSR %

VOL %

2020

2019

DSR %

VOL %

TOTAL TMNA

249,601

207,373

7.5

20.4

2,112,941

2,383,349

-11.9

-11.3

TOTAL DIV. TOYOTA

211,378

172,048

9.7

22.9

1,837,900

2,085,235

-12.4

-11.9

TOTAL LEXUS

38,223

35,325

-3.4

8.2

275,041

298,114

-8.3

-7.7

YARIS

141

932

-86.5

-84.9

6,437

21,916

-70.8

-70.6

COROLLA

25,409

23,742

-4.4

7.0

237,178

304,850

-22.7

-22.2

SUPRA

704

404

55.6

74.3

5,887

2,884

102.8

104.1

86 (INCL. FR-S)

205

276

-33.7

-25.7

2,476

3,398

-27.6

-27.1

MIRAI

20

66

-72.9

-69.7

499

1,502

-67.0

-66.8

AVALON

1,913

1,844

-7.4

3.7

18,421

27,767

-34.1

-33.7

PRIUS

4,078

6,058

-39.9

-32.7

43,525

69,718

-38.0

-37.6

CAMRY

30,364

26,309

3.0

15.4

294,348

336,978

-13.2

-12.7

TOTAL AUTOMÓVILES DIV. TOYOTA

62,834

59,632

-5.9

5.4

608,771

769,014

-21.3

-20.8

IS

2,289

1,171

74.5

95.5

13,600

14,920

-9.4

-8.8

RC

416

428

-13.2

-2.8

3,808

4,591

-17.6

-17.1

ES

5,101

5,025

-9.4

1.5

43,292

51,336

-16.2

-15.7

GS

85

265

-71.4

-67.9

2,560

3,378

-24.7

-24.2

LS

524

583

-19.8

-10.1

3,617

5,528

-35.0

-34.6

LC

230

114

80.1

101.8

1,325

1,219

8.0

8.7

TOTAL AUTOMÓVILES LEXUS

8,645

7,586

1.7

14.0

68,205

80,975

-16.3

-15.8

TOTAL AUTOMÓVILES TMNA

71,479

67,218

-5.1

6.3

676,976

849,989

-20.9

-20.4

SIENNA

7,513

5,176

29.6

45.2

42,885

73,585

-42.1

-41.7

C-HR

3,308

3,303

-10.6

0.2

42,936

48,930

-12.8

-12.3

RAV4

46,846

41,282

1.3

13.5

430,387

448,071

-4.6

-3.9

VENZA

4,495

0

0

0

13,073

9

0

0

HIGHLANDER

26,778

20,449

16.9

31.0

212,276

239,438

-11.9

-11.3

4RUNNER

16,869

11,529

30.6

46.3

129,052

131,888

-2.8

-2.2

SEQUOIA

1,048

876

6.8

19.6

7,364

10,289

-28.9

-28.4

LAND CRUISER

606

360

50.3

68.3

3,147

3,536

-11.6

-11.0

TOTAL SUV DIV. TOYOTA

99,950

77,799

14.7

28.5

838,235

882,162

-5.6

-5.0

TACOMA

28,957

20,727

24.7

39.7

238,806

248,801

-4.6

-4.0

TUNDRA

12,124

8,714

24.2

39.1

109,203

111,673

-2.8

-2.2

TOTAL CAMIONETAS DIV. TOYOTA

41,081

29,441

24.6

39.5

348,009

360,474

-4.1

-3.5

TOTAL CAMIONES DIV. TOYOTA

148,544

112,416

18.0

32.1

1,229,129

1,316,221

-7.2

-6.6

UX

1,848

1,933

-14.6

-4.4

16,962

16,725

0.8

1.4

NX

8,256

7,955

-7.3

3.8

55,784

58,715

-5.6

-5.0

RX

14,514

14,069

-7.9

3.2

101,059

111,036

-9.6

-9.0

GX

4,139

3,220

14.8

28.5

28,519

25,945

9.2

9.9

LX

821

562

30.4

46.1

4,512

4,718

-5.0

-4.4

TOTAL CAMIONES LEXUS

29,578

27,739

-4.8

6.6

206,836

217,139

-5.4

-4.7

TOTAL CAMIONES TMNA

178,122

140,155

13.5

27.1

1,435,965

1,533,360

-7.0

-6.4

Días de ventas

28

25

309

307

DSR = Tasa de ventas diarias

*Vehículos fabricados en Norteamérica 

RESUMEN DE VENTAS DE TOYOTA EN LOS ESTADOS UNIDOS

Diciembre de 2020

— MES EN CURSO —

— AÑO CALENDARIO A LA FECHA —

2020

2019

DSR %

VOL %

2020

2019

DSR %

VOL %

COROLLA

12,192

13,451

-19.1

-9.4

116,915

154,355

-24.7

-24.3

CAMRY

30,364

26,308

3.1

15.4

294,342

336,392

-13.1

-12.5

AVALON

1,913

1,844

-7.4

3.7

18,421

27,767

-34.1

-33.7

YARIS SD (INCL. YARIS IA)

72

241

-73.3

-70.1

2,454

19,730

-87.6

-87.6

YARIS HB

69

685

-91.0

-89.9

3,953

1,817

116.1

117.6

RAV4

39,336

30,148

16.5

30.5

322,908

256,458

25.1

25.9

HIGHLANDER

26,778

20,449

16.9

31.0

212,276

239,437

-11.9

-11.3

SIENNA

7,513

5,176

29.6

45.2

42,885

73,585

-42.1

-41.7

SEQUOIA

1,048

876

6.8

19.6

7,364

10,289

-28.9

-28.4

TACOMA

28,957

20,727

24.7

39.7

238,806

248,801

-4.6

-4.0

TUNDRA

12,124

8,714

24.2

39.1

109,203

111,673

-2.8

-2.2

ES

5,077

4,824

-6.0

5.2

42,961

45,099

-5.4

-4.7

RX

11,235

12,260

-18.2

-8.4

86,584

94,210

-8.7

-8.1

TOTAL

176,678

145,703

8.3

21.3

1,499,072

1,619,622

-8.0

-7.4

% VEHÍCULOS DE NORTEAMÉRICA DEL TOTAL

70.8%

70.3%

70.9%

68.0%

AUTOMÓVILES IMPORTADOS DIV. TOYOTA

18,224

17,103

-4.9

6.6

172,686

228,953

-25.1

-24.6

AUTOMÓVILES IMPORTADOS LEXUS

3,568

2,762

15.3

29.2

25,244

35,876

-30.1

-29.6

AUTOMÓVILES FABRICADOS EN NORTEAMÉRICA DIV. TOYOTA

44,610

42,529

-6.3

4.9

436,085

540,061

-19.8

-19.3

AUTOMÓVILES FABRICADOS EN NORTEAMÉRICA LEXUS

5,077

4,824

-6.0

5.2

42,961

45,099

-5.4

-4.7

TOTAL AUTOMÓVILES TMNA

71,479

67,218

-5.1

6.3

676,976

849,989

-20.9

-20.4

CAMIONES IMPORTADOS DIV. TOYOTA

32,788

26,326

11.2

24.5

295,687

375,969

-21.9

-21.4

CAMIONES IMPORTADOS LEXUS

18,343

15,479

5.8

18.5

120,252

122,929

-2.8

-2.2

CAMIONES FABRICADOS EN NORTEAMÉRICA DIV. TOYOTA

115,756

86,090

20.1

34.5

933,442

940,252

-1.4

-0.7

CAMIONES FABRICADOS EN NORTEAMÉRICA LEXUS

11,235

12,260

-18.2

-8.4

86,584

94,210

-8.7

-8.1

TOTAL CAMIONES TMNA

178,122

140,155

13.5

27.1

1,435,965

1,533,360

-7.0

-6.4

Días de ventas

28

25

309

307

RESUMEN DE VENTAS DE HÍBRIDOS DE TOYOTA EN LOS ESTADOS UNIDOS

Diciembre de 2020

— MES EN CURSO —

— AÑO CALENDARIO A LA FECHA —  

2020

2019

DSR %

VOL. %

2020

2019

DSR %

VOL. %

TOYOTA PRIUS HÍBRIDO

4,078

6,058

-39.9

-32.7

43,525

69,718

-38.0

-37.6

TOYOTA COROLLA HÍBRIDO

2,436

1,545

40.8

57.7

17,628

16,301

7.4

8.1

TOYOTA CAMRY HÍBRIDO

4,600

2,247

82.8

104.7

33,826

26,043

29.0

29.9

TOYOTA AVALON HÍBRIDO

753

571

17.7

31.9

6,714

6,552

1.8

2.5

TOYOTA MIRAI

20

66

-72.9

-69.7

499

1,502

-67.0

-66.8

TOYOTA SIENNA HÍBRIDO

6,909

0

0

0

9,690

0

0

0

TOYOTA HIGHLANDER HÍBRIDO

9,454

1,796

370.0

426.4

48,455

18,248

163.8

165.5

TOYOTA RAV4 HÍBRIDO

11,104

10,127

-2.1

9.7

115,974

92,525

24.5

25.3

TOYOTA RAV4 PRIME

1,070

0

0

0

3,200

0

0

0

TOYOTA VENZA HÍBRIDO

4,495

0

0

0

13,073

0

0

0

LEXUS ES HÍBRIDO

1,138

1,054

-3.6

8.0

8,784

9,073

-3.8

-3.2

LEXUS GS HÍBRIDO

0

0

0

0

1

7

-85.8

-85.7

LEXUS UX HÍBRIDO

1,370

1,089

12.3

25.8

11,818

8,603

36.5

37.4

LEXUS NX HÍBRIDO

1,434

1,230

4.1

16.6

9,358

9,651

-3.7

-3.0

LEXUS RX HÍBRIDO

1,786

1,907

-16.4

-6.3

14,411

16,116

-11.2

-10.6

LEXUS LS HÍBRIDO

0

20

-100

-100

66

187

-64.9

-64.7

LEXUS LC HÍBRIDO

2

3

-40.5

-33.3

14

37

-62.4

-62.2

TOTAL HÍBRIDOS TMNA

50,649

27,713

63.2

82.8

337,036

274,572

22.0

22.7

TOTAL HÍBRIDOS TOYOTA

44,919

22,410

79.0

100.4

292,584

230,898

25.9

26.7

TOTAL HÍBRIDOS LEXUS

5,730

5,303

-3.5

8.1

44,452

43,674

1.1

1.8


Logotipo: https://mma.prnewswire.com/media/439685/Toyota_Corp_Red_Logo.jpg


FUENTE Toyota Motor North America

Paralyzed Veterans of America statement on signing of Veterans Health Care and Benefits Improvement Act of 2020

WASHINGTON, Jan. 6, 2021 /PRNewswire/ — Paralyzed Veterans of America Executive Director Carl Blake released the following statement regarding President Trump’s signing of H.R. 7105, the Johnny Isakson and David P. Roe, M.D. Veterans Health Care and…

WASHINGTON, Jan. 6, 2021 /PRNewswire/ — Paralyzed Veterans of America Executive Director Carl Blake released the following statement regarding President Trump’s signing of H.R. 7105, the Johnny Isakson and David P. Roe, M.D. Veterans Health Care and Benefits Improvement Act of 2020, which enhances the quality of life for veterans, their families, and caregivers:

«Today’s signing of the Johnny Isakson and David P. Roe, M.D. Veterans Health Care and Benefits Improvement Act of 2020 is a win for the entire veteran community. The VA provides preeminent health care for our members who have spinal cord injuries or diseases, such as MS and ALS. Our members rely on the VA system of care, but when they don’t feel safe, can’t get basic exams, or are unable to gain access to health care facilities, they are forced to rely on substandard community care, or worse, they opt not to get care at all.

This bill improves the quality of health care and benefits our members and their survivors receive. It also helps them to live a life of freedom and independence and reduces hardships on their families and caregivers. We are grateful that Congress and the President worked together to recognize the unique needs of our nation’s veterans and stand at the ready to ensure that each provision is implemented effectively.»

Background on H.R. 7105
Our nation’s veterans deserve and expect quality health care and benefits from the government, whether it’s pandemic assistance and proper burials to retraining assistance and housing. This legislation is designed to help the government better deliver critical services, like those noted above, to the veteran community. Other key provisions included in this bill are: eliminating the 12-year delimiting date for disabled veterans to receive counseling, training, and benefits under the Veteran Readiness and Employment program for eligible disabled veterans who separate from military service after January 1, 2013; requiring the VA to provide disability benefits questionnaires online; and lowering the age a surviving spouse may remarry and still receive dependency and indemnity compensation benefits.

About Paralyzed Veterans of America
Paralyzed Veterans of America is the only congressionally chartered veterans service organization dedicated solely for the benefit and representation of veterans with spinal cord injury or disease. For almost 75 years, the organization has ensured that veterans receive the benefits earned through service to our nation; monitored their care in VA spinal cord injury units; and funded research and education in the search for a cure and improved care for individuals with paralysis.

As a life-long partner and advocate for veterans and all people with disabilities, Paralyzed Veterans of America also develops training and career services, works to ensure accessibility in public buildings and spaces and provides health and rehabilitation opportunities through sports and recreation. With more than 70 offices and 33 chapters, Paralyzed Veterans of America serves veterans, their families and their caregivers in all 50 states, the District of Columbia and Puerto Rico. Learn more at pva.org.

CONTACT: Onamé Thompson
(202) 416.7606 office
OnameT@pva.org 

Cision View original content to download multimedia:http://www.prnewswire.com/news-releases/paralyzed-veterans-of-america-statement-on-signing-of-veterans-health-care-and-benefits-improvement-act-of-2020-301202150.html

SOURCE Paralyzed Veterans of America

KPA Acquires iScout to Accelerate Mobile EHS Software Adoption

LAFAYETTE, Colo., Jan. 6, 2021 /PRNewswire-PRWeb/ — Today, KPA, a leading provider of Environment, Health & Safety (EHS) compliance solutions, announced the acquisition of <a target="_blank"…

LAFAYETTE, Colo., Jan. 6, 2021 /PRNewswire-PRWeb/ — Today, KPA, a leading provider of Environment, Health & Safety (EHS) compliance solutions, announced the acquisition of iScout, a provider of flexible, intuitive EHS software designed for small and mid-sized organizations. With iScout, companies can easily collect, evaluate, and share safety information across their organization to cultivate a culture of safety and to enable regulatory compliance. The cloud-based software platform centers on mobile applications for iOS and Android and enables safety managers to manage all aspects of their EHS program with flexible forms for audits and inspections, incident and near-miss management, OSHA reporting, safety training, and more.

«iScout adds tremendous software capability to KPA, and we expect it will accelerate our growth into new markets,» said Chris Fanning, President and CEO of KPA. «We believe iScout will integrate well with our existing, award-winning online training portfolio, and complement our national organization of certified, expert safety and compliance EHS experts.»

The health and safety of employees and customers is a critical focus area for organizations as they continue to respond to the impact of COVID-19 pandemic and implement EHS programs to stay compliant and prepare for the future. The addition of iScout software solutions will help KPA to accelerate market adoption in small and mid-sized companies in industries such as energy, manufacturing, construction, and transportation.

«KPA is a great fit for iScout as we continue to innovate and provide our customers with exceptional software and service to help them manage their EHS programs and keep employees safe,» said Deren Boyd, CEO of iScout. «We share a common vision for helping organizations improve their safety and compliance programs and look forward to combining forces to provide expanded capabilities to our rapidly growing client base.»

Existing iScout operations will continue business as usual, and iScout clients will receive the same high level of customer support as before the acquisition. KPA will continue iScout operations based in Norman, Oklahoma.

iScout’s software platform will compliment KPA’s existing software portfolio that includes Vera Suite, Risk Management Center, and Compligo. KPA, working with its majority shareholder Providence Equity Partners, remains focused on building the industry-leading provider of EHS compliance solutions through organic growth initiatives and strategic acquisitions.

To learn more about iScout and request a free demonstration contact KPA at info@kpa.io.

# # #

About KPA
KPA provides Environment, Health & Safety (EHS), and Workforce Compliance software and services for mid-sized businesses. KPA solutions help clients identify, remedy, and prevent workplace safety and compliance problems across their entire enterprise. The combination of KPA’s Vera Suite software platform, EHS consulting services, and award-winning training content helps organizations minimize risk so they can focus on what’s important—their core business. For over 30 years, KPA has helped 10,000 + clients achieve regulatory compliance, protect assets, and retain top talent. KPA is majority owned by Providence Equity Partners. For more information, go to http://www.kpa.io or call 866.356.1735.

Media Contact

Emily Hartman, KPA, 720-727-0918, ehartman@kpa.io


SOURCE KPA

Silicon Valley’s Grand Hotel Sunnyvale Announces $25 Million Dollar Addition

SUNNYVALE, Calif., Jan. 6, 2021 /PRNewswire/ — The Grand Hotel Sunnyvale, Silicon Valley’s #1 boutique hotel on TripAdvisor, announces its upcoming $25 million dollar annex will be completed June 1, 2021. A 60,000 sq. ft. addition will span 4 floors with 51 new rooms, two state-of-the-art meeting spaces, and a new gym. In total, the hotel will offer 155 rooms and private villas, three indoor meeting spaces that can accommodate up to 80, an…

SUNNYVALE, Calif., Jan. 6, 2021 /PRNewswire/ — The Grand Hotel Sunnyvale, Silicon Valley’s #1 boutique hotel on TripAdvisor, announces its upcoming $25 million dollar annex will be completed June 1, 2021. A 60,000 sq. ft. addition will span 4 floors with 51 new rooms, two state-of-the-art meeting spaces, and a new gym. In total, the hotel will offer 155 rooms and private villas, three indoor meeting spaces that can accommodate up to 80, an outdoor events space for up to 150, outdoor heated pool, and more for business and leisure travelers to Silicon Valley. The hotel is ADA compliant and pet-friendly. Use of the luxury house car, complimentary continental breakfast in room, daily happy hour from California’s local boutique wineries, 24-hr room service, and more are also offered for guests.

The Grand Hotel Sunnyvale, and sister property, The Cupertino Hotel, are under the direction of Area Hotel General Manager Claudio Bono. Bono was recently recognized as a top nominee for California Hotel and Lodging Association’s Outstanding General Manager of the Year 2020 award. «We are incredibly proud of what the hotel has provided for the local community since opening in 2000. And, maybe even more so, for our essential workers and others displaced by COVID-19 within the last year,» said Bono. «Throughout the coronavirus pandemic, The Grand Hotel has provided safe housing for healthcare workers from local medical institutions, such as Kaiser and El Camino, as well as California residents affected by the state’s wildfire crisis,» he continued. «We’re forging forward with the hotel construction in acknowledgment that travel will emerge stronger on the other side of this global pandemic.» A former recipient of the community-lauded CREST Award, «Cupertino Recognizes Extra Steps Taken,» Bono is President Elect for the Cupertino Chamber of Commerce/Silicon Valley.

The new Deluxe Rooms include queen or king-sized beds, floor to ceiling windows, and full-size bathrooms with granite counter tops, dual vanity mirrors, and Jacuzzi tub. Additionally, the rooms are fully equipped with state-of-the-art amenities such as LCD TV, iHome docking station, mini-fridge, plush robes, and 110 mbps Wi-Fi.  The property’s 30 private villas are spacious 1-bedroom suites with 800 sq. ft. private terraces, fireplace, and full kitchen, efficient for extended stays. Recognizing the need for touchless amenities, ALEXA is also installed to allow guests to call for room service or set a wake-up call. Contactless check-in is provided.

The new 600 sq. ft. and 500 sq. ft. meeting spaces will be available for corporate meetings, business events and special occasions. The tech-savvy rooms can host 40 at round tables, 30 in a «U» set-up and up to 80 in a theatre or reception-like arrangement. Outdoor spaces for meetings, weddings, and other events are offered as well.  Contracts will be available from June 2021 onward.

The Grand Hotel is currently open for essential stays only, following the California Travel Advisory For Non-Essential Travel. It operates in accordance with CDC and US Department of Health guidelines. Full covid protocols can be found here: https://www.svgrandhotel.com/cleaning-protocols/.

Nightly rates for June 2021 start at $219 USD. For more information and reservations, please visit https://www.svgrandhotel.com.

Cision View original content to download multimedia:http://www.prnewswire.com/news-releases/silicon-valleys-grand-hotel-sunnyvale-announces-25-million-dollar-addition-301202135.html

SOURCE The Grand Hotel

Worldwide Industry for Electrical Steel to 2027 – Increasing Usage of Electrical Vehicles Presents Opportunities

DUBLIN, Jan. 6, 2021 /PRNewswire/ — The «Electrical Steel Market by Type and Application: Global Opportunity Analysis and Industry Forecast, 2020-2027» report has been added to ResearchAndMarkets.com’s offering.

Research and Markets Logo

The global electrical steel market was valued at $15.0 billion in 2019, and is projected to reach $21.0 billion by 2027, growing at a CAGR of 5.8% from 2020 to 2027.

Electrical steel is a ferromagnetic material containing silicon up to 6.5%. It has the potential to decrease the dissipation of heat, a problem that results in energy wastage. Electrical steel with 6.5% silicon has the most improved electrical and magnetic properties. The inclusion of silicon in steel increases resistivity, decreases hysteresis loss, and enhances permeability. The mostly used commercial electrical steel has around 3.25% of silicon.

One of the significant factors that drive market growth is the increasing demand for energy from developing economies. Furthermore, rise in penetration for electrical vehicles is one of the factors expected to offer lucrative opportunities for the key players operating in the electrical steel market.

The report segments the market on the basis of type, application, and region. By type, it is classified into grain oriented electrical steel and non grain-oriented electrical steel. Based on application, it is sub-divided into transformers, motors, generators, and others. By region, it is analyzed across North America, Europe, Asia-Pacific, and LAMEA.

Key Benefits

  • The report provides an extensive qualitative and quantitative analysis of the current trends and future estimations of the market from 2020 to 2027, determining the prevailing opportunities.
  • A comprehensive analysis of the factors that drive and restrict the growth of the market is provided.
  • The market size is provided in terms of volume and revenue.
  • Porter’s five forces analysis helps analyze the potential of buyers & suppliers and the competitive scenario of the industry for strategy building.
  • Profiles of leading players operating in the market are provided to understand the competitive scenario.
  • The report provides extensive qualitative insights into the significant segments and regions exhibiting favorable growth.

Key Topics Covered:

Chapter 1: Introduction
1.1. Report Description
1.2. Key Benefits for Stakeholders
1.3. Key Market Segments
1.4. Research Methodology
1.4.1. Primary Research
1.4.2. Secondary Research
1.4.3. Analyst Tools and Models

Chapter 2: Executive Summary
2.1. Key Findings of the Study
2.2. Key Findings
2.2.1. Top Investment Pockets
2.3. CXO Perspective

Chapter 3: Market Overview
3.1. Market Definition and Scope
3.2. Key Forces Shaping Electrical Steel Market
3.2.1. Bargaining Power of the Supplier
3.2.2. Bargaining Power of the Buyer
3.2.3. Threat of New Entrant
3.2.4. Threat of Substitutes
3.2.5. Competitive Rivalry
3.3. Market Dynamics
3.3.1. Drivers
3.3.1.1. Increase in Demand from Energy Generation & Transmission Industries
3.3.1.2. Growing Deployment of Renewable Energy
3.3.2. Restraint
3.3.2.1. Volatile Prices of Raw Materials
3.3.3. Opportunity
3.3.3.1. Increasing Usage of Electrical Vehicles
3.4. Value Chain
3.5. Pricing Analysis 2019-2027
3.6. Patent Analysis 2012-2019
3.7. Impact of Covid-19 Outbreak on the Market

Chapter 4: Electrical Steel Market, by Type
4.1. Overview
4.1.1. Market Size and Forecast
4.2. Grain-Oriented Electrical Steel
4.2.1. Key Market Trends, Growth Factors, and Opportunities
4.2.2. Market Size and Forecast, by Region
4.2.3. Market Analysis, by Country
4.3. Non-Grain Oriented Electrical Steel
4.3.1. Key Market Trends, Growth Factors, and Opportunities
4.3.2. Market Size and Forecast, by Region
4.3.3. Market Analysis, by Country

Chapter 5: Electrical Steel Market, by Application
5.1. Overview
5.1.1. Market Size and Forecast
5.2. Transformers
5.2.1. Key Market Trends, Growth Factors, and Opportunities
5.2.2. Market Size and Forecast, by Region
5.2.3. Market Analysis, by Country
5.3. Motors
5.3.1. Key Market Trends, Growth Factors, and Opportunities
5.3.2. Market Size and Forecast, by Region
5.3.3. Market Analysis, by Country
5.4. Generators
5.4.1. Key Market Trends, Growth Factors, and Opportunities
5.4.2. Market Size and Forecast, by Region
5.4.3. Market Analysis, by Country
5.5. Others
5.5.1. Key Market Trends, Growth Factors, and Opportunities
5.5.2. Market Size and Forecast, by Region
5.5.3. Market Analysis, by Country

Chapter 6: Electrical Steel Market, by Region
6.1. Overview
6.1.1. Market Size and Forecast
6.2. North America
6.2.1. Key Market Trends, Growth Factors, and Opportunities
6.2.2. Market Size and Forecast, by Type
6.2.3. Market Size and Forecast, by Application
6.2.4. Market Size and Forecast, by Country
6.2.5. U.S.
6.2.5.1. Market Size and Forecast, by Type
6.2.5.2. Market Size and Forecast, by Application
6.2.6. Canada
6.2.6.1. Market Size and Forecast, by Type
6.2.6.2. Market Size and Forecast, by Application
6.2.7. Mexico
6.2.7.1. Market Size and Forecast, by Type
6.2.7.2. Market Size and Forecast, by Application
6.3. Europe
6.3.1. Key Market Trends, Growth Factors, and Opportunities
6.3.2. Market Size and Forecast, by Type
6.3.3. Market Size and Forecast, by Application
6.3.4. Market Size and Forecast, by Country
6.3.5. Germany
6.3.5.1. Market Size and Forecast, by Type
6.3.5.2. Market Size and Forecast, by Application
6.3.6. France
6.3.6.1. Market Size and Forecast, by Type
6.3.6.2. Market Size and Forecast, by Application
6.3.7. Uk
6.3.7.1. Market Size and Forecast, by Type
6.3.7.2. Market Size and Forecast, by Application
6.3.8. Italy
6.3.8.1. Market Size and Forecast, by Type
6.3.8.2. Market Size and Forecast, by Application
6.3.9. Spain
6.3.9.1. Market Size and Forecast, by Type
6.3.9.2. Market Size and Forecast, by Application
6.3.10. Rest of Europe
6.3.10.1. Market Size and Forecast, by Type
6.3.10.2. Market Size and Forecast, by Application
6.4. Asia-Pacific
6.4.1. Key Market Trends, Growth Factors, and Opportunities
6.4.2. Market Size and Forecast, by Type
6.4.3. Market Size and Forecast, by Application
6.4.4. Market Size and Forecast, by Country
6.4.5. China
6.4.5.1. Market Size and Forecast, by Type
6.4.5.2. Market Size and Forecast, by Application
6.4.6. Japan
6.4.6.1. Market Size and Forecast, by Type
6.4.6.2. Market Size and Forecast, by Application
6.4.7. India
6.4.7.1. Market Size and Forecast, by Type
6.4.7.2. Market Size and Forecast, by Application
6.4.8. Australia
6.4.8.1. Market Size and Forecast, by Type
6.4.8.2. Market Size and Forecast, by Application
6.4.9. South Korea
6.4.9.1. Market Size and Forecast, by Type
6.4.9.2. Market Size and Forecast, by Application
6.4.10. Rest of Asia-Pacific
6.4.10.1. Market Size and Forecast, by Type
6.4.10.2. Market Size and Forecast, by Application
6.5. LAMEA
6.5.1. Key Market Trends, Growth Factors, and Opportunities
6.5.2. Market Size and Forecast, by Type
6.5.3. Market Size and Forecast, by Application
6.5.4. Market Size and Forecast, by Country
6.5.5. Brazil
6.5.5.1. Market Size and Forecast, by Type
6.5.5.2. Market Size and Forecast, by Application
6.5.6. Uae
6.5.6.1. Market Size and Forecast, by Type
6.5.6.2. Market Size and Forecast, by Application
6.5.7. Saudi Arabia
6.5.7.1. Market Size and Forecast, by Type
6.5.7.2. Market Size and Forecast, by Application
6.5.8. South Africa
6.5.8.1. Market Size and Forecast, by Type
6.5.8.2. Market Size and Forecast, by Application
6.5.9. Rest of LAMEA
6.5.9.1. Market Size and Forecast, by Type
6.5.9.2. Market Size and Forecast, by Application

Chapter 7: Competitive Landscape
7.1. Introduction
7.1.1. Market Player Positioning, 2019
7.2. Competitive Heatmap
7.3. Product Mapping of Top 10 Player
7.4. Key Developments
7.4.1. New Product Launches

Chapter 8: Company Profiles
8.1. Aperam
8.1.1. Company Overview
8.1.2. Company Snapshot
8.1.3. Operating Business Segments
8.1.4. Product Portfolio
8.1.5. Business Performance
8.2. Arcelormittal
8.2.1. Company Overview
8.2.2. Company Snapshot
8.2.3. Operating Business Segments
8.2.4. Product Portfolio
8.2.5. R&D Expenditure
8.2.6. Business Performance
8.2.7. Key Strategic Moves and Developments
8.3. Tata Steel
8.3.1. Company Overview
8.3.2. Company Snapshot
8.3.3. Product Portfolio
8.3.4. Business Performance
8.4. Posco
8.4.1. Company Overview
8.4.2. Company Snapshot
8.4.3. Operating Business Segments
8.4.4. Product Portfolio
8.4.5. R&D Expenditure
8.4.6. Business Performance
8.5. Nippon Steel Corporation
8.5.1. Company Overview
8.5.2. Company Snapshot
8.5.3. Operating Business Segments
8.5.4. Product Portfolio
8.5.5. R&D Expenditure
8.5.6. Business Performance
8.6. Baosteel Group Hu
8.6.1. Company Overview
8.6.2. Company Snapshot
8.6.3. Operating Business Segments
8.6.4. Product Portfolio
8.7. Voestalpine AG
8.7.1. Company Overview
8.7.2. Company Snapshot
8.7.3. Operating Business Segments
8.7.4. Product Portfolio
8.7.5. R&D Expenditure
8.7.6. Business Performance
8.8. Jfe Holdings, Inc
8.8.1. Company Overview
8.8.2. Company Snapshot
8.8.3. Operating Business Segments
8.8.4. Product Portfolio
8.8.5. Business Performance
8.9. Cleveland-Cliffs Inc.
8.9.1. Company Overview
8.9.2. Company Snapshot
8.9.3. Product Portfolio
8.9.4. Business Performance
8.10. Slovenian Steel Group
8.10.1. Company Overview
8.10.2. Company Snapshot
8.10.3. Product Portfolio
8.10.4. Business Performance

For more information about this report visit https://www.researchandmarkets.com/r/o1x7ab

Research and Markets also offers Custom Research services providing focused, comprehensive and tailored research.

Media Contact:

Research and Markets
Laura Wood, Senior Manager
press@researchandmarkets.com

For E.S.T Office Hours Call +1-917-300-0470
For U.S./CAN Toll Free Call +1-800-526-8630
For GMT Office Hours Call +353-1-416-8900

U.S. Fax: 646-607-1907
Fax (outside U.S.): +353-1-481-1716

Cision View original content:http://www.prnewswire.com/news-releases/worldwide-industry-for-electrical-steel-to-2027—increasing-usage-of-electrical-vehicles-presents-opportunities-301201918.html

SOURCE Research and Markets

Global Electric Vehicle Charging Infrastructure Market Report 2020: Vendors Offering a Wide Range of Products for AC and DC Charging Stations are Witnessing Better Revenue Growth

DUBLIN, Jan. 6, 2021 /PRNewswire/ — The «The Global Electric Vehicle Charging…

DUBLIN, Jan. 6, 2021 /PRNewswire/ — The «The Global Electric Vehicle Charging Infrastructure Market, 2020» report has been added to ResearchAndMarkets.com’s offering.

Research and Markets Logo

This research looks at 16 of the leading EV charging infrastructure companies and evaluates them based on growth and innovation leadership.

The report presents competitive profiles on each of the companies based on their strengths, opportunities, and market positioning. We discuss strategic market imperatives and the competitive environment that vendors operate in as well as make recommendations each provider should consider to spur growth.

Many surveys conducted across the globe indicate one common issue tied to electric vehicles (EVs): drivers fear not finding a suitable charging station when needed. Globally, increasing demand for EVs has created a significant need for more charging points. About 7.3 million chargers are active across the world (as of 2019), of which, nearly 6.5 million are private chargers, 0.6 million are public slow chargers, and 0.26 million are public fast chargers. China accounts for about 37%, 50%, and 81% of global private, public slow, and public fast chargers, respectively.

Across many global EV markets, home and workplace charging are preferred over public charging stations. Currently, more than 70% of the charging is done at home. Convenience, cost-effectiveness, and a variety of support policies (e.g., tax rebates, equipment purchase incentives, and cash rebates) are the main factors underpinning the dominance of home charging. The publisher believes that in the next 5 years, the 70% home charging rate will drop to 50 to 60% while workplace and public charging will increase.

Charging time is another main concern for drivers because most vehicles have a modest range and require en-route charging from time to time, especially among fleets. This has propelled the development and installation of DC fast chargers (50kW). Although DC fast chargers speed up the charging process, they create the need for improved safety and additional components, such as advanced liquid-cooled cables, substations, and battery energy storage systems.

Companies with such extensive features and offerings for DC fast charging will have an edge for success in this space. In fact, vendors offering a wide range of products for AC and DC charging stations are witnessing better revenue growth compared to companies restricted to a single segment.

Key Issues Addressed

  • Who are the current market leaders in the EV charging infrastructure space?
  • Which companies are moving rapidly in market innovation?
  • What are the strengths of various companies profiled?
  • What kind of opportunities will be created for these companies and how can they align their strengths to benefit and improve their market position?

Key Topics Covered:

1. Strategic Imperative and Growth Environment

  • Strategic Imperative
  • Growth Environment

2. The Research Radar

  • Global EV Charging Infrastructure Market
  • Competitive Environment

3. Companies to Action

  • Asea Brown Boveri (ABB)
  • BP Chargemaster
  • Delta Electronics
  • Eaton
  • Efacec
  • Enel X (eMotorWerks)
  • Ensto
  • EO Charging
  • EVBox (Engie)
  • KEBA Group
  • NewMotion (Shell)
  • Pod Point (EDF)
  • Schneider Electric
  • Siemens
  • Tritium
  • Webasto Group

4. Strategic Insights

5. Next Steps: Leveraging the Research Radar to Empower Key Stakeholders

  • Significance of Being on the Research Radar
  • Empowers the CEO’s Growth Team
  • Empowers Investors
  • Empowers Customers
  • Empowers the Board of Directors

6. Research Radar Analytics

For more information about this report visit https://www.researchandmarkets.com/r/1a49gc

Research and Markets also offers Custom Research services providing focused, comprehensive and tailored research.

Media Contact:

Research and Markets
Laura Wood, Senior Manager
press@researchandmarkets.com

For E.S.T Office Hours Call +1-917-300-0470
For U.S./CAN Toll Free Call +1-800-526-8630
For GMT Office Hours Call +353-1-416-8900

U.S. Fax: 646-607-1907
Fax (outside U.S.): +353-1-481-1716

Cision View original content:http://www.prnewswire.com/news-releases/global-electric-vehicle-charging-infrastructure-market-report-2020-vendors-offering-a-wide-range-of-products-for-ac-and-dc-charging-stations-are-witnessing-better-revenue-growth-301201913.html

SOURCE Research and Markets

ADEPT Driver To Expand Driver Crash Reduction Options in 2021

ELK GROVE, Calif., Jan. 6, 2021 /PRNewswire/ — As the new year dawns, ADEPT Driver looks forward to supporting new advances in driver safety, and making it easier for more customers to use ADEPT’s science-based training programs to sharpen their crash avoidance skills.

<div class="PRN_ImbeddedAssetReference"…

ELK GROVE, Calif., Jan. 6, 2021 /PRNewswire/ — As the new year dawns, ADEPT Driver looks forward to supporting new advances in driver safety, and making it easier for more customers to use ADEPT’s science-based training programs to sharpen their crash avoidance skills.

«In the year ahead we are excited about expanding our proven, award-winning crash reduction technologies and working with innovative partners to increase driver safety,» said Dr. Richard Harkness, CEO of ADEPT Driver. «We also look forward to surpassing half a million drivers who have used our products to improve their crash avoidance skills.»

As of the first week of January, ADEPT has moved its full suite of products online to make it even easier for customers to access and benefit from crash reduction training. Customers can now easily use all of ADEPT’s customized crash avoidance training programs on a computer or tablet. ADEPT offers crash reduction training for drivers of every age, with options including Lifelong Driver for drivers age 60+; Advanced Driver for drivers age 20-60; and teenSMART for teen drivers.

In 2021 ADEPT will introduce Advanced Fleet Driver, a new crash reduction training program under development specifically for commercial fleet drivers.

All ADEPT products provide effective neurocognitive crash-avoidance training for licensed drivers, and incorporate the world’s leading treatment for the causes of driver complacency and technology-induced inattention. ADEPT’s products and science-based crash reduction training are featured in this short video.

ADEPT Driver partners with many insurance companies that offer discounts to customers that complete ADEPT training. As insurers and other strategic partners consider cost effective strategies that help prevent costly and dangerous vehicle crashes, ADEPT recommends two important research reports produced over the past year:

  • Effective Driver Coaching Partnered With Telematics Improves Auto Claims and Customer Loyalty, a White Paper produced by Aite Group, examines how partnering effective crash avoidance training with telematics can help improve the overall driving experience for insurance customers, while reducing claims frequency and severity, improving predictive analytics accuracy, and increasing insurance customer engagement and retention.
  • Safety Benefits of teenSMART Driver Training, a study conducted by Dunlap and Associates, Inc., confirmed that teenSMART, ADEPT’s flagship product, significantly reduces crash frequency and traffic violations. The study shows that teenSMART graduates had an average of 28% and up to a 49% reduction in crashes when compared to a control group. It also found that the teenSMART group had 54% to 67% fewer traffic violations one year after training. The study suggests that to reduce teen driver crash rates, proven crash-reduction training like teenSMART could be integrated into existing graduated driver license programs, and could be effective as part of Phase 2 Driver Education after a young driver has received a first license for unsupervised driving.

To learn more about ADEPT Driver and its mission to deliver science-based training that significantly reduces auto collisions and injuries, click here.

Contact:
Dr. Richard Harkness
916-509-8012
richard@adeptdriver.com


Cision View original content to download multimedia:http://www.prnewswire.com/news-releases/adept-driver-to-expand-driver-crash-reduction-options-in-2021-301202115.html

SOURCE ADEPT Driver

Sense Photonics Demonstrates the World’s First 940nm Global Shutter Flash LiDAR with 200-Meter Range for Mass-Market Automotive Applications

SAN FRANCISCO, Jan. 6, 2021 /PRNewswire/ — Sense Photonics announced today that it has achieved an industry-first by successfully demonstrating 200-meter detection with its proprietary global shutter flash LiDAR system.

The Sense system leverages the company’s proprietary emitter and SPAD sensor technologies. Sense Silicon, a backside illuminated CMOS SPAD device with more than 140,000 pixels, is designed to work seamlessly with the Sense Illuminator, a distributed 940nm laser array of…

SAN FRANCISCO, Jan. 6, 2021 /PRNewswire/ — Sense Photonics announced today that it has achieved an industry-first by successfully demonstrating 200-meter detection with its proprietary global shutter flash LiDAR system.

The Sense system leverages the company’s proprietary emitter and SPAD sensor technologies. Sense Silicon, a backside illuminated CMOS SPAD device with more than 140,000 pixels, is designed to work seamlessly with the Sense Illuminator, a distributed 940nm laser array of more than 15,000 VCSELs. Together, they are the core building blocks of Sense’s camera-like architecture enabling the first high-resolution, eye-safe, global shutter flash LiDAR that can detect 10% reflective targets at 200 meters range in full sunlight outputting tens of millions of points per second. Global shutter acquisition sets a new standard in the long-range LiDAR industry by removing the need for complex motion blur correction while allowing pixel-level, frame-by-frame fusion with RGB camera data.

«We have delivered what industry experts thought was impossible due to our 940nm wavelength, and have created a revolutionary new architecture with the Sense Illuminator, Sense Silicon, and our state-of-the-art signal processing pipeline to miniaturize the data output,» said Hod Finkelstein, CTO, Sense Photonics. «Our LiDAR systems will solve the shortcomings that OEMs, Tier 1 suppliers, and Robotaxi companies have been dealing with in competing LiDAR technologies.»

Geared specifically for mass-market automotive adoption, Sense uses mature manufacturing and cost-effective assembly processes used in today’s consumer technology industries. And unlike legacy LiDAR technologies, Sense’s flash architecture eliminates the need for fine alignment between emitter & receiver, maintaining sensor calibration and depth accuracy during shock and vibration. Additionally, the architecture is designed as a platform to allow for customer-specific product variations with a simple change in optics and the first to be able to provide both short- and long-range capabilities from the same architecture.

«In order to scale past niche automotive R&D projects for ADAS and AV, LiDAR sensors must fit within the vehicle’s acceptable system cost, package and reliability requirements,» said Shauna McIntyre, CEO, Sense Photonics. «Sense pushed the boundaries of performance by designing application-specific VCSELs and SPADs that take advantage of the economics of wafer-scale fabrication.» 

The innovative flash architecture from Sense Photonics is already capturing the interest of automakers, AV companies, and Tier 1 suppliers. Customer evaluation systems are being finalized and will be available mid 2021 to meet current demand requirements, with start of production being planned for late 2024.

About Sense Photonics

Sense Photonics offers high-performance, scalable 3D vision systems to enable mass-market adoption across a wide variety of applications including automotive, trucking, rail and industrial applications such as stationary security. Its core flash technology is protected by over 200 patents and enables a simple, high-performance, solid-state solution with no moving parts. Sense Photonics has offices in San Francisco, CA, Research Triangle Park, NC, Edinburgh, UK and Jerusalem, Israel. It is backed by leading VC firms and strategic investors and has developed partnerships with leading automotive and robotics customers. Visit https://sensephotonics.com for more information.

Cision View original content:http://www.prnewswire.com/news-releases/sense-photonics-demonstrates-the-worlds-first-940nm-global-shutter-flash-lidar-with-200-meter-range-for-mass-market-automotive-applications-301202111.html

SOURCE Sense Photonics

Los camiones y vehículos electrificados impulsan a American Honda a un gran cierre de 2020

TORRANCE, California, 6 de enero de 2021 /PRNewswire-HISPANIC PR WIRE/ —

TORRANCE, California, 6 de enero de 2021 /PRNewswire-HISPANIC PR WIRE/ —

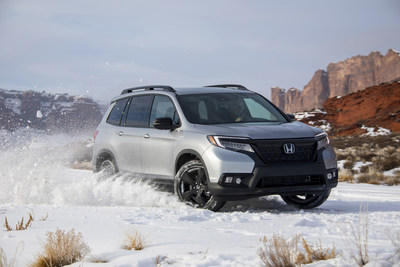
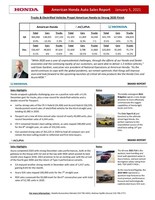
American Honda announced December and Q4 auto sales today, with solid gains by Honda and Acura trucks. The Honda Passport set the bar, setting new December and annual all-time sales records. (PRNewsfoto/American Honda Motor Co., Inc.)


American Honda 

Honda 

Acura

Total 

Automóviles 

Camiones 

Total 

Automóviles 

Camiones 

Total 

Automóviles 

Camiones 

4T

366,068

138,925

227,143

41,329

11,069

30,260

324,739

127,856

196,833

-8.9 %

-13.4 %

-5.9 %

-7.3 %

-8.3 %

-7.5

-9.1 %

-14 %

-5.7 %

Total 

Automóviles 

Camiones 

Total 

Automóviles 

Camiones 

Total 

Automóviles 

Camiones 

Dic.

136,467

48,833

87,634

15,648

3,788

11,860

120,819

45,045

75,774

-0.1 %

-6 %

+3.6 %

-3 %

-10.5 %

-0.3 %

+0.3 %

-5.6 %

+4.2 %


«Si bien el 2020 fue un año de desafíos sin precedentes, gracias a los esfuerzos de nuestros asociados y concesionarios de Honda, y la continua lealtad de nuestros clientes, pudimos entregar 1.3 millones de vehículos», dijo Dave Gardner, vicepresidente ejecutivo de Operaciones Nacionales de American Honda. «Mientras el mundo continúa lidiando con la pandemia global, seguimos siendo optimistas de que las cosas mejorarán pronto y esperamos los próximos lanzamientos de productos totalmente nuevos como el Honda Civic y Acura MDX».


INFORME DE LA MARCA

Aspectos destacados de las ventas 

Notas 

Honda cerró un año desafiante a nivel mundial con una nota positiva de una ganancia de 4.2 % en diciembre en el caso de los camiones, además de un nuevo récord para los vehículos electrificados y un récord doble para Passport.

  • Dirigido por las fuertes ventas del CR-V Hybrid (24,406) y del Accord Hybrid (18,229), Honda registró ventas récord de vehículos electrificados por tercer año consecutivo, con un total de 62,982 vehículos en el 2020.
  • Passport estableció un nuevo récord de ventas anuales de casi 40,000 unidades, además de las ventas récord de diciembre de 4,344 unidades.
  • El CR-V siguió siendo el vehículo más vendido de Honda, ya que las ventas superaron las 300,000 unidades por 8vo año consecutivo, llegando a 333,502 unidades.
  • Civic registró fuertes ventas con 261,225 unidades en el 2020 convirtiéndose en líder de todos los autos compactos y el modelo más vendido a los compradores millennials y quienes compran su automóvil por primera vez.

El Ridgeline 2021, que ha sido audazmente rediseñado, señala una nueva dirección en el diseño para comunicar de manera más efectiva las capacidades resistentes de los camiones ligeros y SUV de Honda.


El Civic Type R LE acaba de lanzarse como el Honda legal de calle definitivo, la piedra angular perfecta para el éxito sin precedentes del Civic de 10ma genración más vendido en el comercio minorista.


INFORME DE LA MARCA

Aspectos destacados de las ventas 

Notas 

Acura completó 2020 con un sólido desempeño en las ventas de diciembre, tanto en la puerta de enlace a la alineación con ILX como en la cima con MDX, que registró su mejor mes desde agosto de 2018. 2021 promete ser un año emocionante con la llegada del MDX de cuarta generación y el regreso de las variantes de rendimiento Type-S.

  • ILX disfrutó de otro buen mes en diciembre con ventas de 1,417 unidades, ganando un 8.6 % en el mes.
  •  Las ventas de SUV Acura superaron las 100,000 unidades por 7mo año consecutivo.
  • Las ventas del RDX superaron la marca de 50,000 por 6to año consecutivo con ventas totales de 52,785 unidades en el 2020.


El totalmente nuevo TLX 2021 es el sedán más rápido, de mejor manejo y mejor equipado en la historia de Acura, y acaba de obtener la calificación de seguridad más alta de IIHS: OPCIÓN DE MEJOR SEGURIDAD +.


Como el nuevo modelo insignia, el MDX 2022 representa un salto cualitativo como el SUV de Acura más premium, centrado en el rendimiento y tecnológicamente sofisticado de todos los tiempos.


Ventas de vehículos de American Honda para diciembre de 2020

Mes en curso a la fecha

Año en curso a la fecha

Diciembre 2020

Diciembre 2019

% de cambio de tasa de venta diaria (DSR)**

% de cambio intermensual

Diciembre 2020

Diciembre 2019

% de cambio de tasa de venta diaria (DSR)**

% de cambio interanual

Total de American Honda

136,467

136,566

-10.8 %

-0.1 %

1,346,788

1,608,170

-16.8 %

-16.3 %

Ventas totales de automóviles

48,833

51,952

-16.1 %

-6.0 %

549,701

706,463

-22.7 %

-22.2 %

Ventas totales de camiones

87,634

84,614

-7.5 %

3.6 %

797,087

901,707

-12.2 %

-11.6 %

Honda

Ventas totales de automóviles

45,045

47,718

-15.7 %

-5.6 %

513,319

663,973

-23.2 %

-22.7 %

Honda

Ventas totales de camiones

75,774

72,715

-7.0 %

4.2 %

696,486

786,812

-12.1 %

-11.5 %

Acura

Ventas totales de automóviles

3,788

4,234

-20.1 %

-10.5 %

36,382

42,490

-14.9 %

-14.4 %

Acura

Ventas totales de camiones

11,860

11,899

-11.0 %

-0.3 %

100,601

114,895

-13.0 %

-12.4 %

* Ventas totales de automóviles nacionales

44,083

46,070

-14.6 %

-4.3 %

492,335

603,197

-18.9 %

-18.4 %

Nacionales

Automóviles

División Honda

40,367

41,908

-14.0 %

-3.7 %

457,008

561,726

-19.2 %

-18.6 %

División Acura

3,716

4,162

-20.3 %

-10.7 %

35,327

41,471

-15.4 %

-14.8 %

* Ventas totales de camiones nacionales

87,633

84,122

-7.0 %

4.2 %

796,444

879,432

-10.0 %

-9.4 %

Nacionales

Camiones

División Honda

75,773

72,223

-6.3 %

4.9 %

695,843

764,537

-9.6 %

-9.0 %

División Acura

11,860

11,899

-11.0 %

-0.3 %

100,601

114,895

-13.0 %

-12.4 %

  Ventas totales de automóviles de importación

4,750

5,882

-27.9 %

-19.2 %

57,366

103,266

-44.8 %

-44.4 %

Importación

Automóviles

División Honda

4,678

5,810

-28.1 %

-19.5 %

56,311

102,247

-45.3 %

-44.9 %

División Acura

72

72

-10.7 %

0.0 %

1,055

1,019

2.9 %

3.5 %

  Ventas totales de camiones de importación

1

492

-99.8 %

-99.8 %

643

22,275

-97.1 %

-97.1 %

Importación

Camiones

División Honda

1

492

-99.8 %

-99.8 %

643

22,275

-97.1 %

-97.1 %

División Acura

0

0

0.0 %

0.0 %

0

0

0.0 %

0.0 %

   DESGLOSE DE MODELOS POR DIVISIÓN

Total de la división Honda

120,819

120,433

-10.4 %

0.3 %

1,209,805

1,450,785

-17.2 %

-16.6 %

Honda

Automóviles

ACCORD

19,509

19,682

-11.5 %

-0.9 %

199,458

267,567

-25.9 %

-25.5 %

CIVIC

21,047

22,913

-18.0 %

-8.1 %

261,225

325,650

-20.3 %

-19.8 %

CLARITY

551

805

-38.9 %

-31.6 %

4,215

11,654

-64.1 %

-63.8 %

CR-Z

0

0

0.0 %

0.0 %

1

2

-50.3 %

-50.0 %

FIT

2,705

2,609

-7.4 %

3.7 %

32,488

35,414

-8.9 %

-8.3 %

INSIGHT

1,233

1,709

-35.6 %

-27.9 %

15,932

23,686

-33.2 %

-32.7 %

Automóviles

Camiones

CR-V

38,120

36,098

-5.7 %

5.6 %

333,502

384,168

-13.8 %

-13.2 %

HR-V

8,428

9,199

-18.2 %

-8.4 %

84,027

99,104

-15.8 %

-15.2 %

ODYSSEY

8,701

8,734

-11.1 %

-0.4 %

83,409

99,113

-16.4 %

-15.8 %

PASSPORT

4,344

3,677

5.5 %

18.1 %

39,567

36,085

8.9 %

9.6 %

PILOT

13,054

11,250

3.6 %

16.0 %

123,813

135,008

-8.9 %

-8.3 %

RIDGELINE

3,127

3,757

-25.7 %

-16.8 %

32,168

33,334

-4.1 %

-3.5 %

Camiones

Total de la división Acura

15,648

16,133

-13.4 %

-3.0 %

136,983

157,385

-13.5 %

-13.0 %

Acura

Automóviles

ILX

1,417

1,305

-3.1 %

8.6 %

13,414

14,685

-9.2 %

-8.7 %

NSX

14

10

25.0 %

40.0 %

128

238

-46.6 %

-46.2 %

RLX / RL

72

72

-10.7 %

0.0 %

1,055

1,019

2.9 %

3.5 %

TLX

2,285

2,847

-28.3 %

-19.7 %

21,785

26,548

-18.5 %

-17.9 %

Automóviles

Camiones

MDX

6,040

5,636

-4.3 %

7.2 %

47,816

52,019

-8.7 %

-8.1 %

RDX

5,820

6,263

-17.0 %

-7.1 %

52,785

62,876

-16.6 %

-16.0 %

Camiones

Días de ventas

28

25

309

307

**** Vehículos electrificados

8,498

4,700

61.4 %

80.8 %

64,792

61,978

3.9 %

4.5 %

*    Los vehículos Honda y Acura están hechos de piezas de origen nacional e internacional.

**   Tasa de ventas diarias

**** Los vehículos electrificados equivalen a: ventas totales de vehículos híbridos (FHEV y PHEV), vehículos eléctricos (BEV) y vehículos de pila de combustible (FCV) de las marcas Honda y Acura.


Honda Logo. (PRNewsFoto/American Honda Motor Co., Inc.) (PRNewsfoto/American Honda Motor Co., Inc.)


Fotografía: https://mma.prnewswire.com/media/1395219/2021_Honda_Passport.jpg
PDF: https://mma.prnewswire.com/media/1395220/Honda_December_Q4_2020_Sales.pdf  
Logotipo: https://mma.prnewswire.com/media/477245/HONDALOGO_Logo.jpg

FUENTE American Honda Motor Co., Inc.