FIBRA Prologis to Host Fourth Quarter 2020 Earnings Conference Call January 28

MEXICO CITY, Jan. 5, 2021 /PRNewswire/ — FIBRA Prologis (BMV: FIBRAPL 14), a leading owner and operator of Class-A logistics real estate in Mexico, will host a webcast and conference call with senior management to discuss fourth quarter results, current market conditions and future outlook on Thursday, January 28, at 9:00 a.m. CT/10:00 a.m. ET.

To access a live broadcast…

MEXICO CITY, Jan. 5, 2021 /PRNewswire/ — FIBRA Prologis (BMV: FIBRAPL 14), a leading owner and operator of Class-A logistics real estate in Mexico, will host a webcast and conference call with senior management to discuss fourth quarter results, current market conditions and future outlook on Thursday, January 28, at 9:00 a.m. CT/10:00 a.m. ET.

To access a live broadcast of the call, dial +1 833 714-0919 (toll-free from the United States and Canada), 01 800 853 0237 (toll-free from Mexico) or +1 778 560-2663 from all other countries and enter conference code 3157918. A live webcast can be accessed at www.fibraprologis.com in the Investor Relations section January 28.

A telephonic replay will be available January 28 – February 3 at +1 800 585-8367 from the U.S. and Canada or at +1 416 621-4642 from all other countries using conference code 3157918. The replay will be posted in the Investor Relations section of the FIBRA Prologis website.

ABOUT FIBRA PROLOGIS

FIBRA Prologis is a leading owner and operator of Class-A industrial real estate in Mexico. As of September 30, 2020, FIBRA Prologis was comprised of 201 logistics and manufacturing facilities in six industrial markets in Mexico totaling 39.0 million square feet (3.6 million square meters) of gross leasable area.

FORWARD-LOOKING STATEMENTS

The statements in this release that are not historical facts are forward-looking statements. These forward-looking statements are based on current expectations, estimates and projections about the industry and markets in which FIBRA Prologis operates, management’s beliefs and assumptions made by management.  Such statements involve uncertainties that could significantly impact FIBRA Prologis financial results. Words such as «expects,» «anticipates,» «intends,» «plans,» «believes,» «seeks,» «estimates,» variations of such words and similar expressions are intended to identify such forward-looking statements, which generally are not historical in nature.  All statements that address operating performance, events or developments that we expect or anticipate will occur in the future — including statements relating to rent and occupancy growth, acquisition activity, development activity, disposition activity, general conditions in the geographic areas where we operate, our debt and financial position, are forward-looking statements. These statements are not guarantees of future performance and involve certain risks, uncertainties and assumptions that are difficult to predict. Although we believe the expectations reflected in any forward-looking statements are based on reasonable assumptions, we can give no assurance that our expectations will be attained and therefore, actual outcomes and results may differ materially from what is expressed or forecasted in such forward-looking statements. Some of the factors that may affect outcomes and results include, but are not limited to: (i) national, international, regional and local economic climates, (ii) changes in financial markets, interest rates and foreign currency exchange rates, (iii) increased or unanticipated competition for our properties, (iv) risks associated with acquisitions, dispositions and development of properties, (v) maintenance of real estate investment trust («FIBRA») status and tax structuring, (vi) availability of financing and capital, the levels of debt that we maintain and our credit ratings, (vii) risks related to our investments (viii) environmental uncertainties, including risks of natural disasters, (ix) risks related to the coronavirus pandemic, and (x) those additional factors discussed in reports filed with the «Comisión Nacional Bancaria y de Valores» and  the Mexican Stock Exchange by FIBRA Prologis under the heading «Risk Factors.» FIBRA Prologis undertakes no duty to update any forward-looking statements appearing in this release.

Non-Solicitation – Any securities discussed herein or in the accompanying presentations, if any, have not been registered under the Securities Act of 1933 or the securities laws of any state and may not be offered or sold in the United States absent registration or an applicable exemption from the registration requirements under the Securities Act and any applicable state securities laws. Any such announcement does not constitute an offer to sell or the solicitation of an offer to buy the securities discussed herein or in the presentations, if and as applicable.

(PRNewsfoto/FIBRA Prologis)


Cision View original content to download multimedia:http://www.prnewswire.com/news-releases/fibra-prologis-to-host-fourth-quarter-2020-earnings-conference-call-january-28-301201563.html

SOURCE FIBRA Prologis

Army Corps of Engineers announces finalization of nationwide permits

WASHINGTON, Jan. 5, 2021 /PRNewswire/ — The U.S. Army Corps of Engineers (USACE) announced today that it reissued 12 and issued four new nationwide permits (NWPs) for work in wetlands and other waters that are regulated by Section 404 of the Clean Water Act and/or Section 10 of the Rivers and Harbors Act of 1899.

The NWPs in this rule replace prior versions of the 2017 Nationwide Permits. The remaining 40 NWPs from 2017 remain in effect through their scheduled March…

WASHINGTON, Jan. 5, 2021 /PRNewswire/ — The U.S. Army Corps of Engineers (USACE) announced today that it reissued 12 and issued four new nationwide permits (NWPs) for work in wetlands and other waters that are regulated by Section 404 of the Clean Water Act and/or Section 10 of the Rivers and Harbors Act of 1899.

The NWPs in this rule replace prior versions of the 2017 Nationwide Permits. The remaining 40 NWPs from 2017 remain in effect through their scheduled March 18, 2022, expiration date. 

A pre-publication copy of the new final NWP rule is posted on the USACE web site at: https://www.usace.army.mil/Missions/Civil-Works/Regulatory-Program-and-Permits/Nationwide-Permits/.

The final rule is scheduled to be published in the Federal Register in the coming weeks. A separate news release will be issued to announce rule publication, and the Federal Register notice will indicate when the permits will take effect and on what date those permits will expire. Until the permits issued by this rule take effect, all 2017 NWPs remain in effect.

The NWPs announced today are the culmination of a notice of proposed rulemaking published in the Federal Register (85 FR 57298) on September 15, 2020, for the reissuance and modification of the 2017 NWPs along with the issuance of five new NWPs. The 60-day public comment period ended November 16, 2020, followed by interagency review and comment.

Nationwide permits authorize activities that are similar in nature and cause only minimal adverse environmental impacts to aquatic resources separately or on a cumulative basis. Activities range from work associated with aids to navigation and utility lines to residential developments and maintenance activities.

Additional information about the USACE Regulatory Program can be found at: https://www.usace.army.mil/Missions/Civil-Works/Regulatory-Program-and-Permits/.

Cision View original content:http://www.prnewswire.com/news-releases/army-corps-of-engineers-announces-finalization-of-nationwide-permits-301201539.html

SOURCE U.S. Army Corps of Engineers

P&O Cruises Australia Extends its Pause in Operations in New Zealand

MIAMI, Jan. 5, 2021 /PRNewswire/ — P&O Cruises Australia is extending its rolling pause in operations in New Zealand to departures on and before 25 April, 2021 as the cruise line and the wider industry continue to work with government and public health authorities on the appropriate time to restart sailing.

The cruise line, which has based ships in Auckland for many years, will return to <span…

MIAMI, Jan. 5, 2021 /PRNewswire/ — P&O Cruises Australia is extending its rolling pause in operations in New Zealand to departures on and before 25 April, 2021 as the cruise line and the wider industry continue to work with government and public health authorities on the appropriate time to restart sailing.

The cruise line, which has based ships in Auckland for many years, will return to New Zealand for a dedicated 150-day season in July 2022.

P&O Cruises Australia President Sture Myrmell said the start of a new year brought renewed optimism and confidence but, at the same time, it was important to remain realistic about the more immediate future.

«We know that much better days lie ahead and we remain positive about the resumption of cruising. While we’ve paused operations, P&O Cruises together with the wider industry has been using the time wisely to plan for cruising’s return,» Mr Myrmell said.

«As we work towards this goal, we wanted to provide our Kiwi guests with as much certainty as possible and flexibility around their 2021 bookings and an opportunity to reschedule their cruise holiday for 2022 or beyond.

«I want to thank our New Zealand guests for their loyalty to P&O Cruises Australia during this time and we look forward to welcoming them back onboard.»

Initially scheduled to start sailing from Auckland from 6 February, 2021, Pacific Explorer’s operations were previously paused to 4 March, 2021 and are now paused to 25 April.

In Australia, Pacific Adventure is currently scheduled to begin sailing from Sydney on 30 April, 2021 while Pacific Encounter is due to call Brisbane home from 7 May – although additional voyages may be added earlier, depending on the timing of the return of cruising in Australia.

The extended pause in operations from New Zealand affects the following cruises:

Pacific Explorer: X112N, X113N, X114N, X115N, X116N, X117N, X118N, X119N, X120N.

Booking and refund options for cancelled cruises from 7 January, 2021:

P&O will make contact with guests whose cruises have been affected, either directly or via their appointed travel agent, to let them know of this development and the options available to them.

Guests who have not yet received an offer in response to a cruise that was cancelled during P&O’s pause in operations are entitled to a full refund or bonus onboard credit if they choose a future cruise credit. 

P&O will pay refunds back to travel agents for guests who booked through that channel. The cruise line will also protect travel agent commissions on all bookings for cancelled cruises that were paid in full as at 5 January, 2021.

Guests with bookings affected by the pause in operations, can track the progress of their future cruise credit or refund request via a new tracking tool found on P&O’s website.

Cision View original content:http://www.prnewswire.com/news-releases/po-cruises-australia-extends-its-pause-in-operations-in-new-zealand-301201524.html

SOURCE P&O Cruises AU

PLM Paves the Way with zero-emissions for the Transport Refrigerated Unit

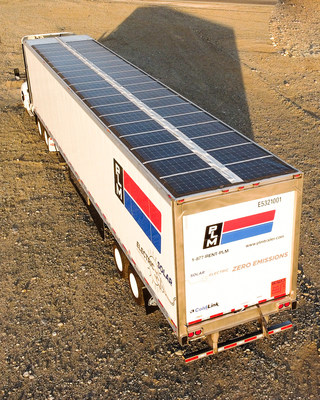
SAN FRANCISCO, Jan. 5, 2021 /PRNewswire/ — PLM Fleet LLC dba PLM Trailer Leasing («PLM») now offers a net-zero emission refrigerated trailer as an alternative energy fleet solution.  Through a partnership with Advanced Energy Machines, («AEM»), the zero emission AEM Solar Tech Transportation Refrigeration Unit («TRU») is a complete all electric solution with an industry standard operating range.  The Solar Tech electric TRU offers best in class design and operation, including:

<div…

SAN FRANCISCO, Jan. 5, 2021 /PRNewswire/ — PLM Fleet LLC dba PLM Trailer Leasing («PLM») now offers a net-zero emission refrigerated trailer as an alternative energy fleet solution.  Through a partnership with Advanced Energy Machines, («AEM»), the zero emission AEM Solar Tech Transportation Refrigeration Unit («TRU») is a complete all electric solution with an industry standard operating range.  The Solar Tech electric TRU offers best in class design and operation, including:

  • Single and multi-temperature options
  • Full-range temperature control and performance
  • 30+ hours of continuous use between charges
  • Fully charged in 8 hours  
  • Weight-neutral compared to traditional diesel TRU
  • Safe, 40-volt DC non-arc charging
PLM Offers Zero Emission Refrigerated Trailer

PLM is the exclusive sales and marketing company for the AEM electric TRU and a California Clean Air Off-Road Equipment («CORE») program approved dealer offering on-site consulting for facility and refrigerated trailers leveraging alternative energy and developing programs to transition your business to clean energy.

PLM’s Vice President of Sales Mike Marshall adds «Through the PLM – AEM partnership customers can be assured that they are getting the best technology offered today; the latest in zero emissions refrigeration technology on the road with leasing, distributed energy site solutions, and complete services support.» Test and trial trailers in a selection of trailer lengths and designs are available today.

  • Personalized training and support structure
  • Remote temperature and operations management with ColdLink® 
  • Complete site evaluation for infrastructure
  • Reservations available, ask about pricing and recommended trial periods

*currently available in California

About PLM
PLM, headquartered in Newark, New Jersey, is an industry leader and the only company with nationwide locations dedicated exclusively to the leasing, rental, maintenance, IoT solutions and fleet management of refrigerated trailers in the Cold Supply Chain.    For more information, please visit www.plmtrailer.com or call 1- 877-736-8756

About AEM
From semiconductors to semi-trailers, AEM founders Ronald and Robert Koelsch have been engineering innovative products and building specialized business relationships for over thirty years. AEM combines years of education and experience in engineering, science, industry, sales, marketing, and business management with patented technology to provide customers with products that are reliable, cost-effective, and commercially viable.  For more information, visit http://www.aem.green

Media Contact

Nicole Greco
PLM
+1 862-229-6480
ngreco@plmfleet.com

Cision View original content to download multimedia:http://www.prnewswire.com/news-releases/plm-paves-the-way-with-zero-emissions-for-the-transport-refrigerated-unit-301201487.html

SOURCE PLM

PLM Paves the Way with zero-emissions for the Transport Refrigerated Unit

SAN FRANCISCO, Jan. 5, 2021 /PRNewswire/ — PLM Fleet LLC dba PLM Trailer Leasing («PLM») now offers a net-zero emission refrigerated trailer as an alternative energy fleet solution.  Through a partnership with Advanced Energy Machines, («AEM»), the zero emission AEM Solar Tech Transportation Refrigeration Unit («TRU») is a complete all electric solution with an industry standard operating range.  The Solar Tech electric TRU offers best in class design and operation, including:

<div…

SAN FRANCISCO, Jan. 5, 2021 /PRNewswire/ — PLM Fleet LLC dba PLM Trailer Leasing («PLM») now offers a net-zero emission refrigerated trailer as an alternative energy fleet solution.  Through a partnership with Advanced Energy Machines, («AEM»), the zero emission AEM Solar Tech Transportation Refrigeration Unit («TRU») is a complete all electric solution with an industry standard operating range.  The Solar Tech electric TRU offers best in class design and operation, including:

  • Single and multi-temperature options
  • Full-range temperature control and performance
  • 30+ hours of continuous use between charges
  • Fully charged in 8 hours  
  • Weight-neutral compared to traditional diesel TRU
  • Safe, 40-volt DC non-arc charging
PLM Offers Zero Emission Refrigerated Trailer

PLM is the exclusive sales and marketing company for the AEM electric TRU and a California Clean Air Off-Road Equipment («CORE») program approved dealer offering on-site consulting for facility and refrigerated trailers leveraging alternative energy and developing programs to transition your business to clean energy.

PLM’s Vice President of Sales Mike Marshall adds «Through the PLM – AEM partnership customers can be assured that they are getting the best technology offered today; the latest in zero emissions refrigeration technology on the road with leasing, distributed energy site solutions, and complete services support.» Test and trial trailers in a selection of trailer lengths and designs are available today.

  • Personalized training and support structure
  • Remote temperature and operations management with ColdLink® 
  • Complete site evaluation for infrastructure
  • Reservations available, ask about pricing and recommended trial periods

*currently available in California

About PLM
PLM, headquartered in Newark, New Jersey, is an industry leader and the only company with nationwide locations dedicated exclusively to the leasing, rental, maintenance, IoT solutions and fleet management of refrigerated trailers in the Cold Supply Chain.    For more information, please visit www.plmtrailer.com or call 1- 877-736-8756

About AEM
From semiconductors to semi-trailers, AEM founders Ronald and Robert Koelsch have been engineering innovative products and building specialized business relationships for over thirty years. AEM combines years of education and experience in engineering, science, industry, sales, marketing, and business management with patented technology to provide customers with products that are reliable, cost-effective, and commercially viable.  For more information, visit http://www.aem.green

Media Contact

Nicole Greco
PLM
+1 862-229-6480
ngreco@plmfleet.com

Cision View original content to download multimedia:http://www.prnewswire.com/news-releases/plm-paves-the-way-with-zero-emissions-for-the-transport-refrigerated-unit-301201487.html

SOURCE PLM

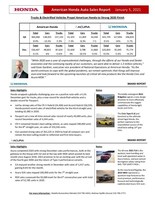
Trucks & Electrified Vehicles Propel American Honda to Strong 2020 Finish

TORRANCE, Calif., Jan. 5, 2021 /PRNewswire-HISPANIC PR WIRE/ —

TORRANCE, Calif., Jan. 5, 2021 /PRNewswire-HISPANIC PR WIRE/ —

American Honda

Honda

Acura

Total

Cars

Trucks

Total

Cars

Trucks

Total

Cars

Trucks

Q4

366,068

138,925

227,143

41,329

11,069

30,260

324,739

127,856

196,833

-8.9%

-13.4%

-5.9%

-7.3%

-8.3%

-7.5

-9.1%

-14%

-5.7%

Total

Cars

Trucks

Total

Cars

Trucks

Total

Cars

Trucks

Dec.

136,467

48,833

87,634

15,648

3,788

11,860

120,819

45,045

75,774

-0.1%

-6%

+3.6%

-3%

-10.5%

-0.3%

+0.3%

-5.6%

+4.2%

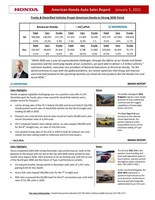
«While 2020 was a year of unprecedented challenges, through the efforts of our Honda and Dealer associates and the continuing loyalty of our customers, we were able to deliver 1.3 million vehicles,» said Dave Gardner, executive vice president of National Operations at American Honda. «As the world continues to cope with the global pandemic, we remain optimistic that things will improve soon and look forward to the upcoming launches of critical all-new products like the Honda Civic and Acura MDX.»

BRAND REPORT

Sales Highlights

Notes

Honda wrapped a globally-challenging year on a positive note with a 4.2% December gain for trucks, plus a new record for electrified vehicles and a double record for Passport.

   •    Led by strong sales of the CR-V Hybrid (24,406) and Accord Hybrid (18,229), Honda posted record sales of electrified vehicles for the third straight year, totaling 62,982 in 2020.

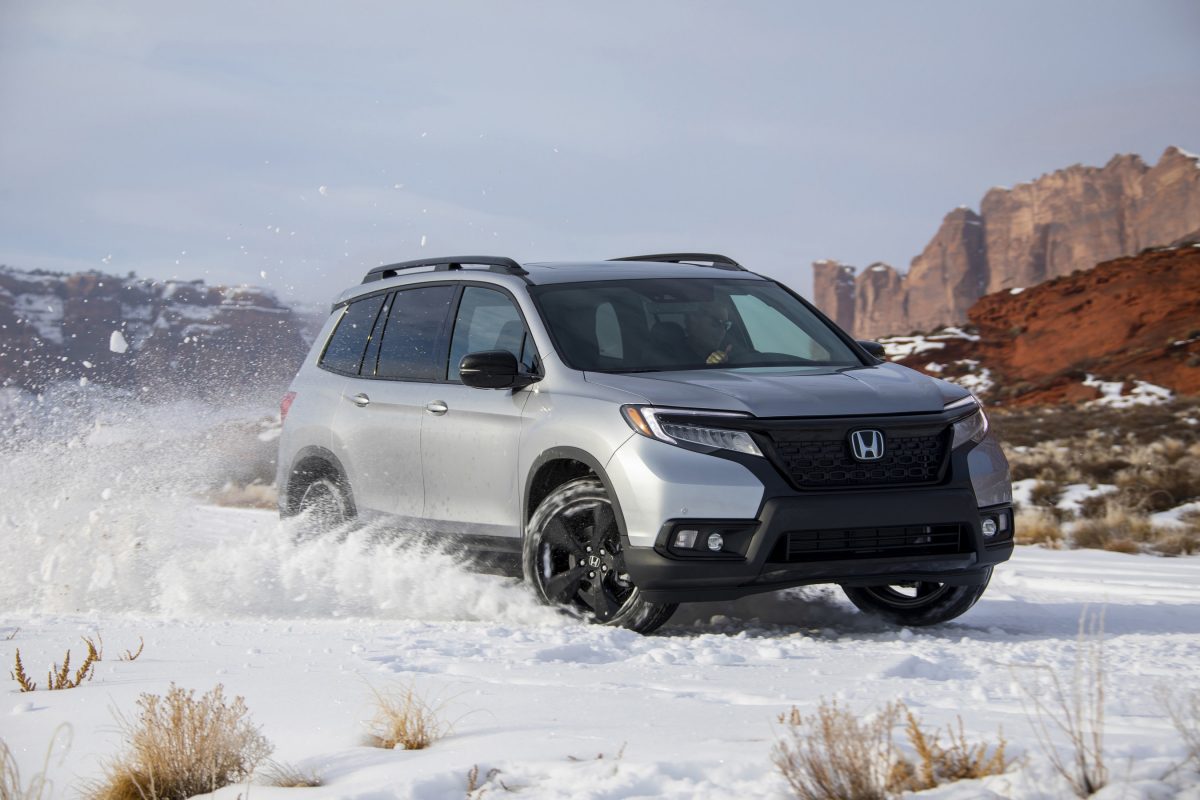
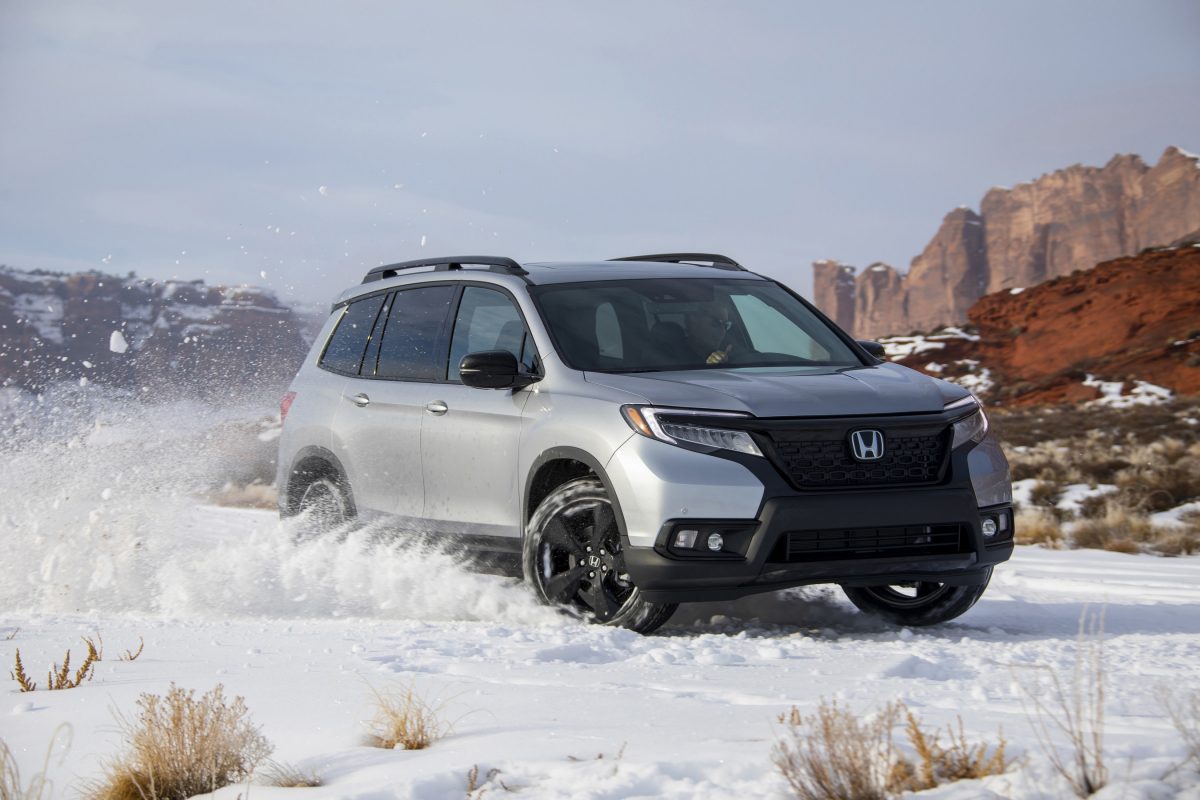
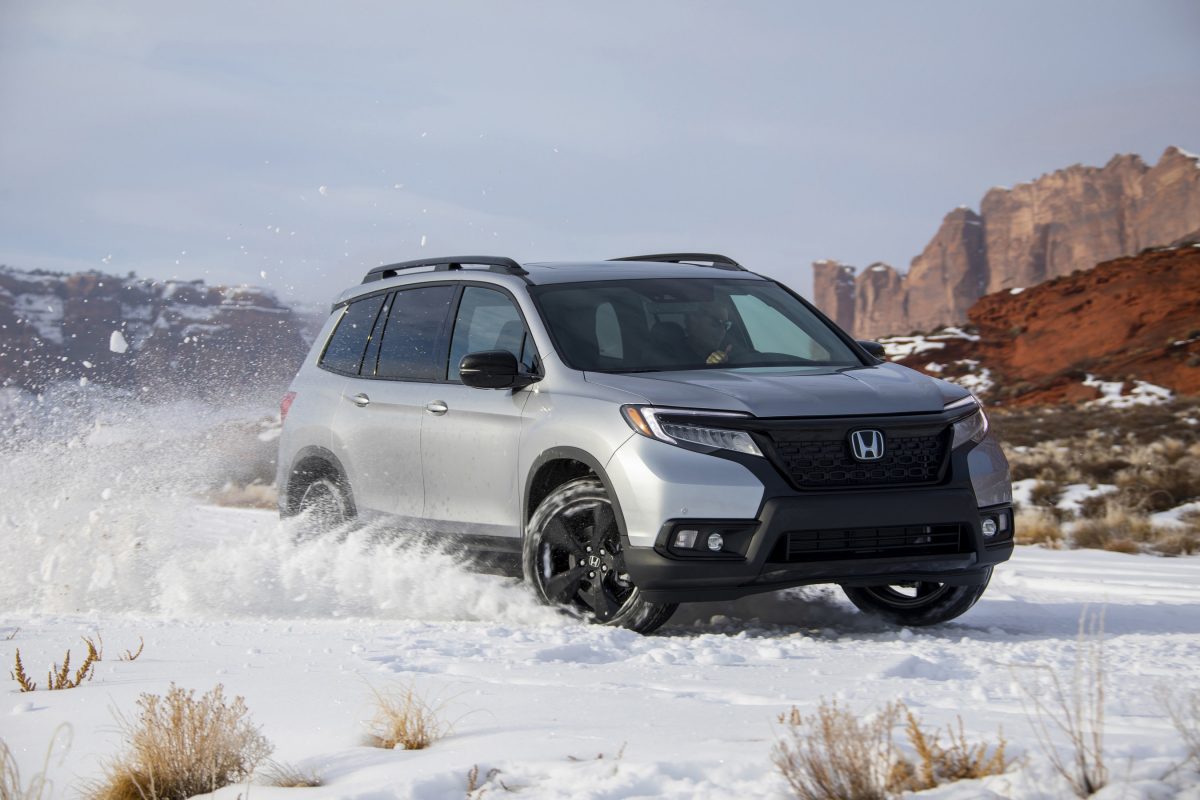
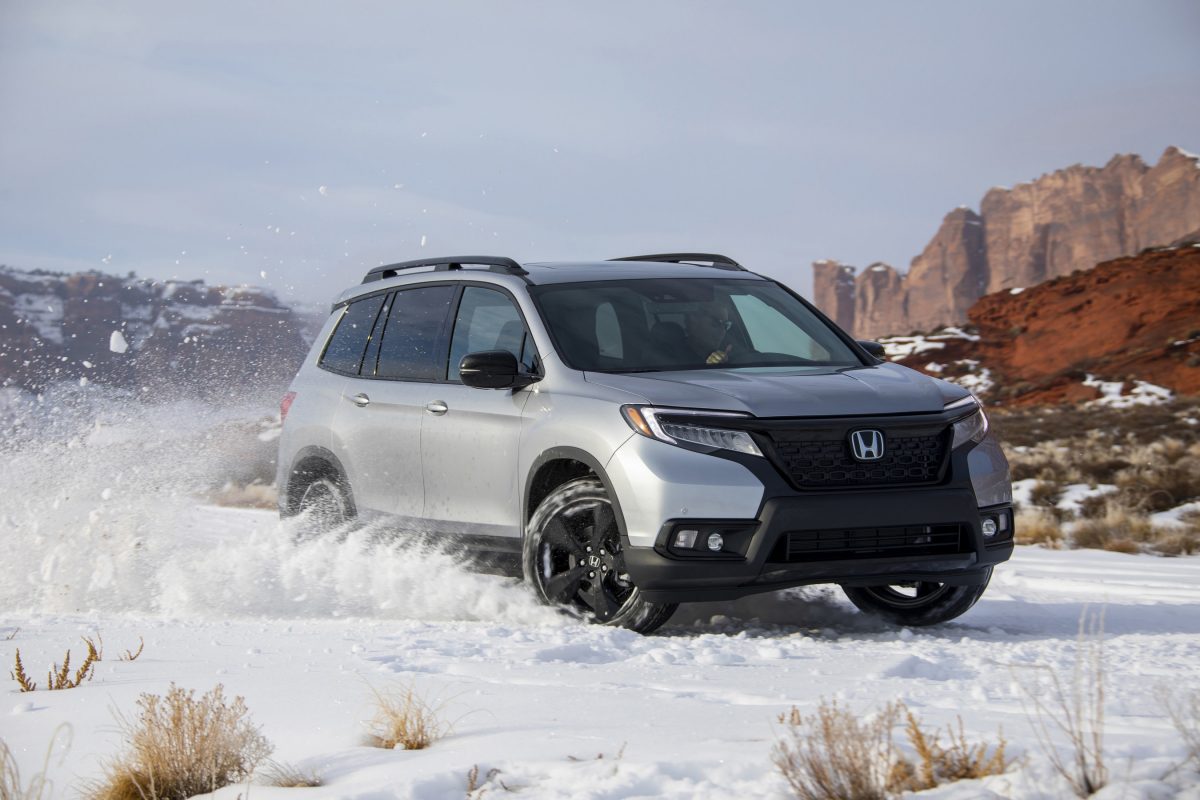
   •   Passport set a new all-time annual sales record of nearly 40,000 units, plus record December sales of 4,344 units.

   •   CR-V remained Honda’s best-selling vehicle, as sales topped 300,000 units for the 8th straight year, on sales of 333,502 units.

   •   Civic posted strong sales of 261,225 in 2020 to lead all compact cars and remain the best-selling model to millennial and first-time buyers.

The boldly redesigned 2021 Ridgeline signals a new design direction to more effectively communicate the rugged capabilities of Honda light trucks and SUVs.


The Civic Type R LE just launched as the ultimate street-legal Honda, the perfect capstone to the unparalleled success of the retail best-selling 10th gen Civic.


BRAND REPORT

Sales Highlights

Notes

Acura completed 2020 with strong December sales performances, both at the gateway to the lineup with ILX and at the top with MDX which posted its best month since August 2018. 2021 promises to be an exciting year with the arrival of the fourth-gen MDX and the return of Type-S performance variants.

   •   ILX enjoyed another strong month in December with sales of 1,417 units, gaining 8.6% for the month.

   •   Acura SUV sales topped 100,000 units for the 7th straight year.

   •   RDX sales surpassed the 50,000 mark for the 6th consecutive year with total sales of 52,785 units in 2020.


The all-new 2021 TLX is the quickest, best-handling and most well-appointed sedan in Acura history, and just earned the highest safety rating from IIHS: TOP SAFETY PICK+.


As the new brand flagship, the 2022 MDX represents a quantum leap forward as the most premium, performance-focused and technologically sophisticated Acura SUV ever.


American Honda Vehicle Sales for December 2020

Month-to-Date

Year-to-Date

December 2020

December 2019

DSR** % Change

MoM % Change

December 2020

December 2019

DSR** % Change

YoY % Change

American Honda Total

136,467

136,566

-10.8%

-0.1%

1,346,788

1,608,170

-16.8%

-16.3%

Total Car Sales

48,833

51,952

-16.1%

-6.0%

549,701

706,463

-22.7%

-22.2%

Total Truck Sales

87,634

84,614

-7.5%

3.6%

797,087

901,707

-12.2%

-11.6%

Honda

Total Car Sales

45,045

47,718

-15.7%

-5.6%

513,319

663,973

-23.2%

-22.7%

Honda

Total Truck Sales

75,774

72,715

-7.0%

4.2%

696,486

786,812

-12.1%

-11.5%

Acura

Total Car Sales

3,788

4,234

-20.1%

-10.5%

36,382

42,490

-14.9%

-14.4%

Acura

Total Truck Sales

11,860

11,899

-11.0%

-0.3%

100,601

114,895

-13.0%

-12.4%

* Total Domestic Car Sales

44,083

46,070

-14.6%

-4.3%

492,335

603,197

-18.9%

-18.4%

Domestic

Car

Honda Division

40,367

41,908

-14.0%

-3.7%

457,008

561,726

-19.2%

-18.6%

Acura Division

3,716

4,162

-20.3%

-10.7%

35,327

41,471

-15.4%

-14.8%

* Total Domestic Truck Sales

87,633

84,122

-7.0%

4.2%

796,444

879,432

-10.0%

-9.4%

Domestic

Truck

Honda Division

75,773

72,223

-6.3%

4.9%

695,843

764,537

-9.6%

-9.0%

Acura Division

11,860

11,899

-11.0%

-0.3%

100,601

114,895

-13.0%

-12.4%

  Total Import Car Sales

4,750

5,882

-27.9%

-19.2%

57,366

103,266

-44.8%

-44.4%

Import

Car

Honda Division

4,678

5,810

-28.1%

-19.5%

56,311

102,247

-45.3%

-44.9%

Acura Division

72

72

-10.7%

0.0%

1,055

1,019

2.9%

3.5%

  Total Import Truck Sales

1

492

-99.8%

-99.8%

643

22,275

-97.1%

-97.1%

Import

Truck

Honda Division

1

492

-99.8%

-99.8%

643

22,275

-97.1%

-97.1%

Acura Division

0

0

0.0%

0.0%

0

0

0.0%

0.0%

   MODEL BREAKOUT BY DIVISION

Honda Division Total

120,819

120,433

-10.4%

0.3%

1,209,805

1,450,785

-17.2%

-16.6%

Honda

Car

ACCORD

19,509

19,682

-11.5%

-0.9%

199,458

267,567

-25.9%

-25.5%

CIVIC

21,047

22,913

-18.0%

-8.1%

261,225

325,650

-20.3%

-19.8%

CLARITY

551

805

-38.9%

-31.6%

4,215

11,654

-64.1%

-63.8%

CR-Z

0

0

0.0%

0.0%

1

2

-50.3%

-50.0%

FIT

2,705

2,609

-7.4%

3.7%

32,488

35,414

-8.9%

-8.3%

INSIGHT

1,233

1,709

-35.6%

-27.9%

15,932

23,686

-33.2%

-32.7%

Car

Truck

CR-V

38,120

36,098

-5.7%

5.6%

333,502

384,168

-13.8%

-13.2%

HR-V

8,428

9,199

-18.2%

-8.4%

84,027

99,104

-15.8%

-15.2%

ODYSSEY

8,701

8,734

-11.1%

-0.4%

83,409

99,113

-16.4%

-15.8%

PASSPORT

4,344

3,677

5.5%

18.1%

39,567

36,085

8.9%

9.6%

PILOT

13,054

11,250

3.6%

16.0%

123,813

135,008

-8.9%

-8.3%

RIDGELINE

3,127

3,757

-25.7%

-16.8%

32,168

33,334

-4.1%

-3.5%

Truck

Acura Division Total

15,648

16,133

-13.4%

-3.0%

136,983

157,385

-13.5%

-13.0%

Acura

Car

ILX

1,417

1,305

-3.1%

8.6%

13,414

14,685

-9.2%

-8.7%

NSX

14

10

25.0%

40.0%

128

238

-46.6%

-46.2%

RLX / RL

72

72

-10.7%

0.0%

1,055

1,019

2.9%

3.5%

TLX

2,285

2,847

-28.3%

-19.7%

21,785

26,548

-18.5%

-17.9%

Car

Truck

MDX

6,040

5,636

-4.3%

7.2%

47,816

52,019

-8.7%

-8.1%

RDX

5,820

6,263

-17.0%

-7.1%

52,785

62,876

-16.6%

-16.0%

Truck

Selling Days

28

25

309

307

**** Electrified Vehicles

8,498

4,700

61.4%

80.8%

64,792

61,978

3.9%

4.5%

*    Honda and Acura vehicles are made of domestic & global sourced parts

**   Daily Selling Rate

**** Electrified Vehicles equal: Total sales of Hybrid (FHEV & PHEV), EVs (BEV) and Fuel Cell Vehicles (FCV) from the Honda and Acura brands.


Photo – https://mma.prnewswire.com/media/1395217/2021_Honda_Passport.jpg
PDF – https://mma.prnewswire.com/media/1395218/Honda_December_Q4_2020_Sales.pdf 
Logo – https://mma.prnewswire.com/media/477245/HONDALOGO_Logo.jpg

SOURCE American Honda Motor Co., Inc.

Trucks & Electrified Vehicles Propel American Honda to Strong 2020 Finish

TORRANCE, Calif., Jan. 5, 2021 /PRNewswire-HISPANIC PR WIRE/ —

TORRANCE, Calif., Jan. 5, 2021 /PRNewswire-HISPANIC PR WIRE/ —

American Honda

Honda

Acura

Total

Cars

Trucks

Total

Cars

Trucks

Total

Cars

Trucks

Q4

366,068

138,925

227,143

41,329

11,069

30,260

324,739

127,856

196,833

-8.9%

-13.4%

-5.9%

-7.3%

-8.3%

-7.5

-9.1%

-14%

-5.7%

Total

Cars

Trucks

Total

Cars

Trucks

Total

Cars

Trucks

Dec.

136,467

48,833

87,634

15,648

3,788

11,860

120,819

45,045

75,774

-0.1%

-6%

+3.6%

-3%

-10.5%

-0.3%

+0.3%

-5.6%

+4.2%

«While 2020 was a year of unprecedented challenges, through the efforts of our Honda and Dealer associates and the continuing loyalty of our customers, we were able to deliver 1.3 million vehicles,» said Dave Gardner, executive vice president of National Operations at American Honda. «As the world continues to cope with the global pandemic, we remain optimistic that things will improve soon and look forward to the upcoming launches of critical all-new products like the Honda Civic and Acura MDX.»

BRAND REPORT

Sales Highlights

Notes

Honda wrapped a globally-challenging year on a positive note with a 4.2% December gain for trucks, plus a new record for electrified vehicles and a double record for Passport.

   •    Led by strong sales of the CR-V Hybrid (24,406) and Accord Hybrid (18,229), Honda posted record sales of electrified vehicles for the third straight year, totaling 62,982 in 2020.

   •   Passport set a new all-time annual sales record of nearly 40,000 units, plus record December sales of 4,344 units.

   •   CR-V remained Honda’s best-selling vehicle, as sales topped 300,000 units for the 8th straight year, on sales of 333,502 units.

   •   Civic posted strong sales of 261,225 in 2020 to lead all compact cars and remain the best-selling model to millennial and first-time buyers.

The boldly redesigned 2021 Ridgeline signals a new design direction to more effectively communicate the rugged capabilities of Honda light trucks and SUVs.


The Civic Type R LE just launched as the ultimate street-legal Honda, the perfect capstone to the unparalleled success of the retail best-selling 10th gen Civic.


BRAND REPORT

Sales Highlights

Notes

Acura completed 2020 with strong December sales performances, both at the gateway to the lineup with ILX and at the top with MDX which posted its best month since August 2018. 2021 promises to be an exciting year with the arrival of the fourth-gen MDX and the return of Type-S performance variants.

   •   ILX enjoyed another strong month in December with sales of 1,417 units, gaining 8.6% for the month.

   •   Acura SUV sales topped 100,000 units for the 7th straight year.

   •   RDX sales surpassed the 50,000 mark for the 6th consecutive year with total sales of 52,785 units in 2020.


The all-new 2021 TLX is the quickest, best-handling and most well-appointed sedan in Acura history, and just earned the highest safety rating from IIHS: TOP SAFETY PICK+.


As the new brand flagship, the 2022 MDX represents a quantum leap forward as the most premium, performance-focused and technologically sophisticated Acura SUV ever.


American Honda Vehicle Sales for December 2020

Month-to-Date

Year-to-Date

December 2020

December 2019

DSR** % Change

MoM % Change

December 2020

December 2019

DSR** % Change

YoY % Change

American Honda Total

136,467

136,566

-10.8%

-0.1%

1,346,788

1,608,170

-16.8%

-16.3%

Total Car Sales

48,833

51,952

-16.1%

-6.0%

549,701

706,463

-22.7%

-22.2%

Total Truck Sales

87,634

84,614

-7.5%

3.6%

797,087

901,707

-12.2%

-11.6%

Honda

Total Car Sales

45,045

47,718

-15.7%

-5.6%

513,319

663,973

-23.2%

-22.7%

Honda

Total Truck Sales

75,774

72,715

-7.0%

4.2%

696,486

786,812

-12.1%

-11.5%

Acura

Total Car Sales

3,788

4,234

-20.1%

-10.5%

36,382

42,490

-14.9%

-14.4%

Acura

Total Truck Sales

11,860

11,899

-11.0%

-0.3%

100,601

114,895

-13.0%

-12.4%

* Total Domestic Car Sales

44,083

46,070

-14.6%

-4.3%

492,335

603,197

-18.9%

-18.4%

Domestic

Car

Honda Division

40,367

41,908

-14.0%

-3.7%

457,008

561,726

-19.2%

-18.6%

Acura Division

3,716

4,162

-20.3%

-10.7%

35,327

41,471

-15.4%

-14.8%

* Total Domestic Truck Sales

87,633

84,122

-7.0%

4.2%

796,444

879,432

-10.0%

-9.4%

Domestic

Truck

Honda Division

75,773

72,223

-6.3%

4.9%

695,843

764,537

-9.6%

-9.0%

Acura Division

11,860

11,899

-11.0%

-0.3%

100,601

114,895

-13.0%

-12.4%

  Total Import Car Sales

4,750

5,882

-27.9%

-19.2%

57,366

103,266

-44.8%

-44.4%

Import

Car

Honda Division

4,678

5,810

-28.1%

-19.5%

56,311

102,247

-45.3%

-44.9%

Acura Division

72

72

-10.7%

0.0%

1,055

1,019

2.9%

3.5%

  Total Import Truck Sales

1

492

-99.8%

-99.8%

643

22,275

-97.1%

-97.1%

Import

Truck

Honda Division

1

492

-99.8%

-99.8%

643

22,275

-97.1%

-97.1%

Acura Division

0

0

0.0%

0.0%

0

0

0.0%

0.0%

   MODEL BREAKOUT BY DIVISION

Honda Division Total

120,819

120,433

-10.4%

0.3%

1,209,805

1,450,785

-17.2%

-16.6%

Honda

Car

ACCORD

19,509

19,682

-11.5%

-0.9%

199,458

267,567

-25.9%

-25.5%

CIVIC

21,047

22,913

-18.0%

-8.1%

261,225

325,650

-20.3%

-19.8%

CLARITY

551

805

-38.9%

-31.6%

4,215

11,654

-64.1%

-63.8%

CR-Z

0

0

0.0%

0.0%

1

2

-50.3%

-50.0%

FIT

2,705

2,609

-7.4%

3.7%

32,488

35,414

-8.9%

-8.3%

INSIGHT

1,233

1,709

-35.6%

-27.9%

15,932

23,686

-33.2%

-32.7%

Car

Truck

CR-V

38,120

36,098

-5.7%

5.6%

333,502

384,168

-13.8%

-13.2%

HR-V

8,428

9,199

-18.2%

-8.4%

84,027

99,104

-15.8%

-15.2%

ODYSSEY

8,701

8,734

-11.1%

-0.4%

83,409

99,113

-16.4%

-15.8%

PASSPORT

4,344

3,677

5.5%

18.1%

39,567

36,085

8.9%

9.6%

PILOT

13,054

11,250

3.6%

16.0%

123,813

135,008

-8.9%

-8.3%

RIDGELINE

3,127

3,757

-25.7%

-16.8%

32,168

33,334

-4.1%

-3.5%

Truck

Acura Division Total

15,648

16,133

-13.4%

-3.0%

136,983

157,385

-13.5%

-13.0%

Acura

Car

ILX

1,417

1,305

-3.1%

8.6%

13,414

14,685

-9.2%

-8.7%

NSX

14

10

25.0%

40.0%

128

238

-46.6%

-46.2%

RLX / RL

72

72

-10.7%

0.0%

1,055

1,019

2.9%

3.5%

TLX

2,285

2,847

-28.3%

-19.7%

21,785

26,548

-18.5%

-17.9%

Car

Truck

MDX

6,040

5,636

-4.3%

7.2%

47,816

52,019

-8.7%

-8.1%

RDX

5,820

6,263

-17.0%

-7.1%

52,785

62,876

-16.6%

-16.0%

Truck

Selling Days

28

25

309

307

**** Electrified Vehicles

8,498

4,700

61.4%

80.8%

64,792

61,978

3.9%

4.5%

*    Honda and Acura vehicles are made of domestic & global sourced parts

**   Daily Selling Rate

**** Electrified Vehicles equal: Total sales of Hybrid (FHEV & PHEV), EVs (BEV) and Fuel Cell Vehicles (FCV) from the Honda and Acura brands.


Photo – https://mma.prnewswire.com/media/1395217/2021_Honda_Passport.jpg
PDF – https://mma.prnewswire.com/media/1395218/Honda_December_Q4_2020_Sales.pdf 
Logo – https://mma.prnewswire.com/media/477245/HONDALOGO_Logo.jpg

SOURCE American Honda Motor Co., Inc.

Trucks & Electrified Vehicles Propel American Honda to Strong 2020 Finish

TORRANCE, Calif., Jan. 5, 2021 /PRNewswire-HISPANIC PR WIRE/ —

TORRANCE, Calif., Jan. 5, 2021 /PRNewswire-HISPANIC PR WIRE/ —

American Honda

Honda

Acura

Total

Cars

Trucks

Total

Cars

Trucks

Total

Cars

Trucks

Q4

366,068

138,925

227,143

41,329

11,069

30,260

324,739

127,856

196,833

-8.9%

-13.4%

-5.9%

-7.3%

-8.3%

-7.5

-9.1%

-14%

-5.7%

Total

Cars

Trucks

Total

Cars

Trucks

Total

Cars

Trucks

Dec.

136,467

48,833

87,634

15,648

3,788

11,860

120,819

45,045

75,774

-0.1%

-6%

+3.6%

-3%

-10.5%

-0.3%

+0.3%

-5.6%

+4.2%

«While 2020 was a year of unprecedented challenges, through the efforts of our Honda and Dealer associates and the continuing loyalty of our customers, we were able to deliver 1.3 million vehicles,» said Dave Gardner, executive vice president of National Operations at American Honda. «As the world continues to cope with the global pandemic, we remain optimistic that things will improve soon and look forward to the upcoming launches of critical all-new products like the Honda Civic and Acura MDX.»

BRAND REPORT

Sales Highlights

Notes

Honda wrapped a globally-challenging year on a positive note with a 4.2% December gain for trucks, plus a new record for electrified vehicles and a double record for Passport.

   •    Led by strong sales of the CR-V Hybrid (24,406) and Accord Hybrid (18,229), Honda posted record sales of electrified vehicles for the third straight year, totaling 62,982 in 2020.

   •   Passport set a new all-time annual sales record of nearly 40,000 units, plus record December sales of 4,344 units.

   •   CR-V remained Honda’s best-selling vehicle, as sales topped 300,000 units for the 8th straight year, on sales of 333,502 units.

   •   Civic posted strong sales of 261,225 in 2020 to lead all compact cars and remain the best-selling model to millennial and first-time buyers.

The boldly redesigned 2021 Ridgeline signals a new design direction to more effectively communicate the rugged capabilities of Honda light trucks and SUVs.


The Civic Type R LE just launched as the ultimate street-legal Honda, the perfect capstone to the unparalleled success of the retail best-selling 10th gen Civic.


BRAND REPORT

Sales Highlights

Notes

Acura completed 2020 with strong December sales performances, both at the gateway to the lineup with ILX and at the top with MDX which posted its best month since August 2018. 2021 promises to be an exciting year with the arrival of the fourth-gen MDX and the return of Type-S performance variants.

   •   ILX enjoyed another strong month in December with sales of 1,417 units, gaining 8.6% for the month.

   •   Acura SUV sales topped 100,000 units for the 7th straight year.

   •   RDX sales surpassed the 50,000 mark for the 6th consecutive year with total sales of 52,785 units in 2020.


The all-new 2021 TLX is the quickest, best-handling and most well-appointed sedan in Acura history, and just earned the highest safety rating from IIHS: TOP SAFETY PICK+.


As the new brand flagship, the 2022 MDX represents a quantum leap forward as the most premium, performance-focused and technologically sophisticated Acura SUV ever.


American Honda Vehicle Sales for December 2020

Month-to-Date

Year-to-Date

December 2020

December 2019

DSR** % Change

MoM % Change

December 2020

December 2019

DSR** % Change

YoY % Change

American Honda Total

136,467

136,566

-10.8%

-0.1%

1,346,788

1,608,170

-16.8%

-16.3%

Total Car Sales

48,833

51,952

-16.1%

-6.0%

549,701

706,463

-22.7%

-22.2%

Total Truck Sales

87,634

84,614

-7.5%

3.6%

797,087

901,707

-12.2%

-11.6%

Honda

Total Car Sales

45,045

47,718

-15.7%

-5.6%

513,319

663,973

-23.2%

-22.7%

Honda

Total Truck Sales

75,774

72,715

-7.0%

4.2%

696,486

786,812

-12.1%

-11.5%

Acura

Total Car Sales

3,788

4,234

-20.1%

-10.5%

36,382

42,490

-14.9%

-14.4%

Acura

Total Truck Sales

11,860

11,899

-11.0%

-0.3%

100,601

114,895

-13.0%

-12.4%

* Total Domestic Car Sales

44,083

46,070

-14.6%

-4.3%

492,335

603,197

-18.9%

-18.4%

Domestic

Car

Honda Division

40,367

41,908

-14.0%

-3.7%

457,008

561,726

-19.2%

-18.6%

Acura Division

3,716

4,162

-20.3%

-10.7%

35,327

41,471

-15.4%

-14.8%

* Total Domestic Truck Sales

87,633

84,122

-7.0%

4.2%

796,444

879,432

-10.0%

-9.4%

Domestic

Truck

Honda Division

75,773

72,223

-6.3%

4.9%

695,843

764,537

-9.6%

-9.0%

Acura Division

11,860

11,899

-11.0%

-0.3%

100,601

114,895

-13.0%

-12.4%

  Total Import Car Sales

4,750

5,882

-27.9%

-19.2%

57,366

103,266

-44.8%

-44.4%

Import

Car

Honda Division

4,678

5,810

-28.1%

-19.5%

56,311

102,247

-45.3%

-44.9%

Acura Division

72

72

-10.7%

0.0%

1,055

1,019

2.9%

3.5%

  Total Import Truck Sales

1

492

-99.8%

-99.8%

643

22,275

-97.1%

-97.1%

Import

Truck

Honda Division

1

492

-99.8%

-99.8%

643

22,275

-97.1%

-97.1%

Acura Division

0

0

0.0%

0.0%

0

0

0.0%

0.0%

   MODEL BREAKOUT BY DIVISION

Honda Division Total

120,819

120,433

-10.4%

0.3%

1,209,805

1,450,785

-17.2%

-16.6%

Honda

Car

ACCORD

19,509

19,682

-11.5%

-0.9%

199,458

267,567

-25.9%

-25.5%

CIVIC

21,047

22,913

-18.0%

-8.1%

261,225

325,650

-20.3%

-19.8%

CLARITY

551

805

-38.9%

-31.6%

4,215

11,654

-64.1%

-63.8%

CR-Z

0

0

0.0%

0.0%

1

2

-50.3%

-50.0%

FIT

2,705

2,609

-7.4%

3.7%

32,488

35,414

-8.9%

-8.3%

INSIGHT

1,233

1,709

-35.6%

-27.9%

15,932

23,686

-33.2%

-32.7%

Car

Truck

CR-V

38,120

36,098

-5.7%

5.6%

333,502

384,168

-13.8%

-13.2%

HR-V

8,428

9,199

-18.2%

-8.4%

84,027

99,104

-15.8%

-15.2%

ODYSSEY

8,701

8,734

-11.1%

-0.4%

83,409

99,113

-16.4%

-15.8%

PASSPORT

4,344

3,677

5.5%

18.1%

39,567

36,085

8.9%

9.6%

PILOT

13,054

11,250

3.6%

16.0%

123,813

135,008

-8.9%

-8.3%

RIDGELINE

3,127

3,757

-25.7%

-16.8%

32,168

33,334

-4.1%

-3.5%

Truck

Acura Division Total

15,648

16,133

-13.4%

-3.0%

136,983

157,385

-13.5%

-13.0%

Acura

Car

ILX

1,417

1,305

-3.1%

8.6%

13,414

14,685

-9.2%

-8.7%

NSX

14

10

25.0%

40.0%

128

238

-46.6%

-46.2%

RLX / RL

72

72

-10.7%

0.0%

1,055

1,019

2.9%

3.5%

TLX

2,285

2,847

-28.3%

-19.7%

21,785

26,548

-18.5%

-17.9%

Car

Truck

MDX

6,040

5,636

-4.3%

7.2%

47,816

52,019

-8.7%

-8.1%

RDX

5,820

6,263

-17.0%

-7.1%

52,785

62,876

-16.6%

-16.0%

Truck

Selling Days

28

25

309

307

**** Electrified Vehicles

8,498

4,700

61.4%

80.8%

64,792

61,978

3.9%

4.5%

*    Honda and Acura vehicles are made of domestic & global sourced parts

**   Daily Selling Rate

**** Electrified Vehicles equal: Total sales of Hybrid (FHEV & PHEV), EVs (BEV) and Fuel Cell Vehicles (FCV) from the Honda and Acura brands.


Photo – https://mma.prnewswire.com/media/1395217/2021_Honda_Passport.jpg
PDF – https://mma.prnewswire.com/media/1395218/Honda_December_Q4_2020_Sales.pdf 
Logo – https://mma.prnewswire.com/media/477245/HONDALOGO_Logo.jpg

SOURCE American Honda Motor Co., Inc.

Comerica Bank’s California Index Ticked Higher

DALLAS, Jan. 5, 2021 /PRNewswire/ — Comerica Bank’s California Economic Activity Index increased in October to a level of 101.0. October’s reading is 12 percent above the historical low of 90.3. The index averaged 124.4 points in 2019, 0.5 points above the average for all of 2018. September’s index reading was 97.7.

<a…

DALLAS, Jan. 5, 2021 /PRNewswire/ — Comerica Bank’s California Economic Activity Index increased in October to a level of 101.0. October’s reading is 12 percent above the historical low of 90.3. The index averaged 124.4 points in 2019, 0.5 points above the average for all of 2018. September’s index reading was 97.7.

Our California Economic Activity Index improved again in October, now up for the fourth consecutive month. The index components were generally positive in October. Six of the eight components saw gains for the month including nonfarm employment, unemployment insurance claims (inverted), housing starts, house prices, the Dow Jones Technology Index and hotel occupancy. Industrial electricity demand and state total trade were both negative for the month. The October acceleration in our California Index is consistent with the delayed reopening of the state’s economy compared to other key Comerica states this fall. California’s jobs recovery rate continued to improve through November with the state regaining 46 percent of the net jobs lost this spring. However, the gains have not been evenly distributed across all sectors.    Housing and healthcare related sectors appear to be leading the state’s jobs recovery, while manufacturing and education services are lagging. This data does not take into account the surge in COVID-19 cases in November and the subsequent reimplementation of strict social mitigation policies in December. Limited-to-zero ICU capacity in the San Joaquin Valley and Southern California may result in longer stay at home orders for the two regions into at least mid-January. We still expect the widespread distribution of a vaccine to support stronger economic activity for the state in the second half of 2021.

The California Economic Activity Index consists of eight variables, as follows: nonfarm payroll employment, continuing claims for unemployment insurance, housing starts, house price index, industrial electricity sales, total trade, technology stock index and hotel occupancy. All data are seasonally adjusted. Nominal values have been converted to constant dollar values. Index levels are expressed in terms of three-month moving averages.

Comerica Incorporated (NYSE: CMA) is a financial services company headquartered in Dallas, Texas, and strategically aligned by three business segments: The Commercial Bank, The Retail Bank, and Wealth Management. Comerica focuses on relationships, and helping people and businesses be successful. In addition to Texas, Comerica Bank locations can be found in Arizona, California, Florida and Michigan, with select businesses operating in several other states, as well as in Canada and Mexico. Comerica reported total assets of $83.6 billion at September 30, 2020.

To subscribe to our publications or for questions, contact us at ComericaEcon@comerica.com. Archives are available at http://www.comerica.com/insights. Follow us on Twitter: @Comerica_Econ.

Cision View original content to download multimedia:http://www.prnewswire.com/news-releases/comerica-banks-california-index-ticked-higher-301201451.html

SOURCE Comerica Bank

Trucks & Electrified Vehicles Propel American Honda to Strong 2020 Finish

TORRANCE, Calif., Jan. 5, 2021 /PRNewswire/ —

TORRANCE, Calif., Jan. 5, 2021 /PRNewswire/ —

American Honda

Honda

Acura

Total

Cars

Trucks

Total

Cars

Trucks

Total

Cars

Trucks

Q4

366,068

138,925

227,143

41,329

11,069

30,260

324,739

127,856

196,833

-8.9%

-13.4%

-5.9%

-7.3%

-8.3%

-7.5

-9.1%

-14%

-5.7%

Total

Cars

Trucks

Total

Cars

Trucks

Total

Cars

Trucks

Dec.

136,467

48,833

87,634

15,648

3,788

11,860

120,819

45,045

75,774

-0.1%

-6%

+3.6%

-3%

-10.5%

-0.3%

+0.3%

-5.6%

+4.2%

«While 2020 was a year of unprecedented challenges, through the efforts of our Honda and Dealer associates and the continuing loyalty of our customers, we were able to deliver 1.3 million vehicles,» said Dave Gardner, executive vice president of National Operations at American Honda. «As the world continues to cope with the global pandemic, we remain optimistic that things will improve soon and look forward to the upcoming launches of critical all-new products like the Honda Civic and Acura MDX.»

BRAND REPORT

Sales Highlights

Notes

Honda wrapped a globally-challenging year on a positive note with a 4.2% December gain for trucks, plus a new record for electrified vehicles and a double record for Passport.

   •    Led by strong sales of the CR-V Hybrid (24,406) and Accord Hybrid (18,229), Honda posted record sales of electrified vehicles for the third straight year, totaling 62,982 in 2020.

   •   Passport set a new all-time annual sales record of nearly 40,000 units, plus record December sales of 4,344 units.

   •   CR-V remained Honda’s best-selling vehicle, as sales topped 300,000 units for the 8th straight year, on sales of 333,502 units.

   •   Civic posted strong sales of 261,225 in 2020 to lead all compact cars and remain the best-selling model to millennial and first-time buyers.

The boldly redesigned 2021 Ridgeline signals a new design direction to more effectively communicate the rugged capabilities of Honda light trucks and SUVs.


The Civic Type R LE just launched as the ultimate street-legal Honda, the perfect capstone to the unparalleled success of the retail best-selling 10th gen Civic.


BRAND REPORT

Sales Highlights

Notes

Acura completed 2020 with strong December sales performances, both at the gateway to the lineup with ILX and at the top with MDX which posted its best month since August 2018. 2021 promises to be an exciting year with the arrival of the fourth-gen MDX and the return of Type-S performance variants.

   •   ILX enjoyed another strong month in December with sales of 1,417 units, gaining 8.6% for the month.

   •   Acura SUV sales topped 100,000 units for the 7th straight year.

   •   RDX sales surpassed the 50,000 mark for the 6th consecutive year with total sales of 52,785 units in 2020.


The all-new 2021 TLX is the quickest, best-handling and most well-appointed sedan in Acura history, and just earned the highest safety rating from IIHS: TOP SAFETY PICK+.


As the new brand flagship, the 2022 MDX represents a quantum leap forward as the most premium, performance-focused and technologically sophisticated Acura SUV ever.


American Honda Vehicle Sales for December 2020

Month-to-Date

Year-to-Date

December 2020

December 2019

DSR** % Change

MoM % Change

December 2020

December 2019

DSR** % Change

YoY % Change

American Honda Total

136,467

136,566

-10.8%

-0.1%

1,346,788

1,608,170

-16.8%

-16.3%

Total Car Sales

48,833

51,952

-16.1%

-6.0%

549,701

706,463

-22.7%

-22.2%

Total Truck Sales

87,634

84,614

-7.5%

3.6%

797,087

901,707

-12.2%

-11.6%

Honda

Total Car Sales

45,045

47,718

-15.7%

-5.6%

513,319

663,973

-23.2%

-22.7%

Honda

Total Truck Sales

75,774

72,715

-7.0%

4.2%

696,486

786,812

-12.1%

-11.5%

Acura

Total Car Sales

3,788

4,234

-20.1%

-10.5%

36,382

42,490

-14.9%

-14.4%

Acura

Total Truck Sales

11,860

11,899

-11.0%

-0.3%

100,601

114,895

-13.0%

-12.4%

* Total Domestic Car Sales

44,083

46,070

-14.6%

-4.3%

492,335

603,197

-18.9%

-18.4%

Domestic

Car

Honda Division

40,367

41,908

-14.0%

-3.7%

457,008

561,726

-19.2%

-18.6%

Acura Division

3,716

4,162

-20.3%

-10.7%

35,327

41,471

-15.4%

-14.8%

* Total Domestic Truck Sales

87,633

84,122

-7.0%

4.2%

796,444

879,432

-10.0%

-9.4%

Domestic

Truck

Honda Division

75,773

72,223

-6.3%

4.9%

695,843

764,537

-9.6%

-9.0%

Acura Division

11,860

11,899

-11.0%

-0.3%

100,601

114,895

-13.0%

-12.4%

  Total Import Car Sales

4,750

5,882

-27.9%

-19.2%

57,366

103,266

-44.8%

-44.4%

Import

Car

Honda Division

4,678

5,810

-28.1%

-19.5%

56,311

102,247

-45.3%

-44.9%

Acura Division

72

72

-10.7%

0.0%

1,055

1,019

2.9%

3.5%

  Total Import Truck Sales

1

492

-99.8%

-99.8%

643

22,275

-97.1%

-97.1%

Import

Truck

Honda Division

1

492

-99.8%

-99.8%

643

22,275

-97.1%

-97.1%

Acura Division

0

0

0.0%

0.0%

0

0

0.0%

0.0%

   MODEL BREAKOUT BY DIVISION

Honda Division Total

120,819

120,433

-10.4%

0.3%

1,209,805

1,450,785

-17.2%

-16.6%

Honda

Car

ACCORD

19,509

19,682

-11.5%

-0.9%

199,458

267,567

-25.9%

-25.5%

CIVIC

21,047

22,913

-18.0%

-8.1%

261,225

325,650

-20.3%

-19.8%

CLARITY

551

805

-38.9%

-31.6%

4,215

11,654

-64.1%

-63.8%

CR-Z

0

0

0.0%

0.0%

1

2

-50.3%

-50.0%

FIT

2,705

2,609

-7.4%

3.7%

32,488

35,414

-8.9%

-8.3%

INSIGHT

1,233

1,709

-35.6%

-27.9%

15,932

23,686

-33.2%

-32.7%

Car

Truck

CR-V

38,120

36,098

-5.7%

5.6%

333,502

384,168

-13.8%

-13.2%

HR-V

8,428

9,199

-18.2%

-8.4%

84,027

99,104

-15.8%

-15.2%

ODYSSEY

8,701

8,734

-11.1%

-0.4%

83,409

99,113

-16.4%

-15.8%

PASSPORT

4,344

3,677

5.5%

18.1%

39,567

36,085

8.9%

9.6%

PILOT

13,054

11,250

3.6%

16.0%

123,813

135,008

-8.9%

-8.3%

RIDGELINE

3,127

3,757

-25.7%

-16.8%

32,168

33,334

-4.1%

-3.5%

Truck

Acura Division Total

15,648

16,133

-13.4%

-3.0%

136,983

157,385

-13.5%

-13.0%

Acura

Car

ILX

1,417

1,305

-3.1%

8.6%

13,414

14,685

-9.2%

-8.7%

NSX

14

10

25.0%

40.0%

128

238

-46.6%

-46.2%

RLX / RL

72

72

-10.7%

0.0%

1,055

1,019

2.9%

3.5%

TLX

2,285

2,847

-28.3%

-19.7%

21,785

26,548

-18.5%

-17.9%

Car

Truck

MDX

6,040

5,636

-4.3%

7.2%

47,816

52,019

-8.7%

-8.1%

RDX

5,820

6,263

-17.0%

-7.1%

52,785

62,876

-16.6%

-16.0%

Truck

Selling Days

28

25

309

307

**** Electrified Vehicles

8,498

4,700

61.4%

80.8%

64,792

61,978

3.9%

4.5%

*    Honda and Acura vehicles are made of domestic & global sourced parts

**   Daily Selling Rate

**** Electrified Vehicles equal: Total sales of Hybrid (FHEV & PHEV), EVs (BEV) and Fuel Cell Vehicles (FCV) from the Honda and Acura brands.


Cision View original content to download multimedia:http://www.prnewswire.com/news-releases/trucks–electrified-vehicles-propel-american-honda-to-strong-2020-finish-301201461.html

SOURCE American Honda Motor Co., Inc.