How 400 Year Old Blood Taxis Created A $5.7 Trillion Industry

LONDON, Jan. 5, 2021 /PRNewswire/ — Nearly 400 years ago, a French businessman may have launched the start of an estimated $5.7 trillion industry, the estimate of value that Uber puts on all passenger vehicle miles and all public transportation miles in all countries globally. Mentioned in today’s commentary includes: Uber…

LONDON, Jan. 5, 2021 /PRNewswire/ — Nearly 400 years ago, a French businessman may have launched the start of an estimated $5.7 trillion industry, the estimate of value that Uber puts on all passenger vehicle miles and all public transportation miles in all countries globally. Mentioned in today’s commentary includes: Uber Technologies, Inc. (NYSE: UBER), Lyft, Inc. (NASDAQ: LYFT), Alphabet Inc. (NASDAQ: GOOGL), Tesla, Inc. (NASDAQ: TSLA), Amazon.com, Inc. (NASDAQ: AMZN).

At the time, many elites used his «fiacres» to move around Paris secretly and commit illegal acts without gaining attention. But today, it’s led to an industry that’s revolutionized the way people around the world work and travel every day…

By 2021 giving over 540 million people the ability to catch a ride anywhere they’d like at a moment’s notice, without owning their own vehicle. That’s why Uber has seen shares jump 149% since earlier this year…And Lyft shares soared 170% over that time…

All during the biggest pandemic in over a century, which has forced many to stay home and avoid using transportation as a service. But the industry Uber took over just a decade ago is now set to be changed yet again…By a $30 trillion mega-trend that’s been slowly building over the last several years.

All the biggest names are pouring money into it as well. Goldman Sachs started a $1.5 billion fund in this area, which is becoming a go-to for major companies like Apple and JetBlue Airways. Amazon founder, Jeff Bezos, just devoted $10 billion to the mega-trend. And BlackRock, the largest asset manager in the world, plans to have $1.2 trillion in ESG assets within the next 10 years. 

In the coming months and years, it could lead to the biggest revolution in transportation since the invention of the Model T. And one company from Canada’s Silicon Valley is matching the ESG trend to the next generation of transportation: Facedrive (FD; FDVRF).

This $30 Trillion Mega-trend is Taking Over the Markets

ESG investing – the ethical and eco-friendly investing trend – has skyrocketed in popularity in recent years. Even with the stock market plummeting earlier this year with the start of the pandemic, ESG funds held their own and later continued to soar.  This is why many of the biggest names in Wall Street have started investing so heavily in this mega-trend. 

BlackRock has been quick to jump on the trend, already having over $90 billion in ESG assets to date. But they’re planning to more than 10x that number over time, as they’ve announced they plan to boost that to $1.2 trillion by the year 2030.

They’re not alone though. Many across Wall Street and beyond are touting the massive potential they see for the ESG mega-trend in the days ahead.

Nigel Green, the CEO of the deVere Group, says that the global pandemic has only accelerated this trend and that ESG investing is moving toward a «skyward surge.» And Financial News recently touted that the pandemic is «fuelling an unprecedented explosion in ESG investing.»

The brains behind Facedrive saw this trend coming and, through next-gen technology and partnering with environmental agencies, positioned themselves to lead the pack. They give riders the choice to hail a ride from an electric, hybrid, or gas-powered vehicle, all without paying an extra premium for the option. After the ride, their in-app algorithm calculates how much CO2 was created for each journey, and sets aside a portion of the fare to offset the carbon footprint – planting trees to do it.

That puts Facedrive squarely in the middle of two megatrends. The estimated $5.7 trillion transportation service industry… and big money’s shift into sustainable investing, already over $30 trillion as of 2018.

Big Names are Helping them Expand Worldwide

With the amount of money behind this growing ESG trend, it’s no surprise Facedrive is already making connections with major players around the world. Facedrive (FD; FDVRF) is aiming to become a household name, and Will Smith’s Bel Air Athletics clothing brand is betting big on them as the ride of the future. And it’s clear that with this partnership, Facedrive isn’t just focused on delivering a ride from point A to point B. 

They’re aiming to become a brand name that spans far beyond that. They’ve taken a creative approach in creating TraceSCAN – a wearable technology used to help slow or stop the spread of the coronavirus through contact tracing.

The Government of Ontario recently announced they’re endorsing and supporting the deployment of this breakthrough technology. And, even Air Canada – the largest airline in the country – has started a pilot project with Facedrive to provide their employees with the technology to help curb the spread of the virus.

Loads of Different Streams of Revenue

Facedrive (FD; FDVRF) is quickly becoming a one-stop-shop for all your car transportation needs, but they’re also aiming to be much more than that.

With their commitment to «people and planet first» that goes beyond just ridesharing…It’s opened the door for plenty of new streams of revenue through partnerships and acquisitions, which they call Facedrive Verticals.

During a year where many companies are struggling to stay afloat, they’ve managed to find creative opportunities to expand their business worldwide. And with the addition of several new verticals, Facedrive is bringing in new revenue from all angles.

A Better Solution for Both Drivers and Passengers

Even with a massive $30 trillion trend and A-list celebrities behind your name, your service needs to deliver if you expect drivers and riders to jump on board. This is why Facedrive has made the decision an absolute no-brainer for all involved.

Millennials vote with their wallet, and they show their values with it too. Many say they’re willing to pay 25% more for a service to support a cause that’s important to them. Many are looking at Facedrive (FD; FDVRF) to become the rideshare of the future — grabbing hold of this $30 trillion mega-trend. 

Industry Heavyweights Are Jumping On Board, As Well

Amazon (AMZN) has committed to the ESG push in a big way. And on multiple fronts. In 2019, founder and CEO Jeff Bezos launched a landmark $10 billion climate change fund, but that was only the start of its deep dive into sustainability. In fact, since then, Amazon has even dove into the transportation of the future, leading a $700 million investment round in the groundbreaking EV startup Rivian.

But Amazon hasn’t stopped there. Bezos’ e-commerce giant has also pledged to go completely carbon neutral a full decade ahead of the Paris Climate Agreement. And as a part of that pledge, Amazon has committed to powering all of its operations by 100% renewable energy by 2025.

In a statement on its website Amazon noted, «We believe supply chain transparency is crucial to our approach to human rights due diligence and ensuring worker protections…When we receive information about potential issues in our supply chain, we investigate and take appropriate action to remediate.»

Its conscious approach to the marketplace, in addition to 2020’s pandemic-fueled e-commerce boom helped Amazon’s stock price jump from $1,906 per share to over $3,180 at the time of writing, representing a 66% increase from January last year. 

Despite being a bit late to jump on the sustainability train, Uber Technologies (UBER) is finally making some changes in its operations. In late 2019, a scathing report about how much the ride-sharing giant was contributing to emissions emerged, suggesting that Uber and Lyft added as much as 70% more to global emissions than traditional alternatives prompting backlash among environmentalists.

In fact, Uber even rolled out a new program to help drivers transition to electric vehicles. The $800 million ‘Green Future’ initiative, with the help of Chevrolet, allows drivers to get a near-$3000 discount on Bolt EV Premiers.

While Uber’s share price stumbled at the beginning of 2020, its food delivery business and its fresh approach to the looming climate crisis have helped the company’s share price jump from a low of just $18 in March of last year to its current price of $50.

Like Uber, Lyft Inc (LYFT) has also made leaps and bounds in its commitment to a greener tomorrow. In fact, it has even rolled out a massive push to fully-electrify its fleet within the decade. The company is already working closely with its partners and policymakers to make electric vehicles more accessible to its drivers, but the best is yet to come.

John Zimmer, co-founder and president of Lyft explained, «Now more than ever, we need to work together to create cleaner, healthier, and more equitable communities,» adding, «Success breeds success, and if we do this right, it creates a path for others.»

Lyft’s stock price was a roller-coaster in 2020, primarily due to the major hit its services took as lockdowns across the globe weighed on demand for its services. Despite this impact, however, Lyft’s share price bounced back from a low of around $18 in March to its current price of $46.

It’s impossible to mention sustainability without touching on the impact that Big Tech has had. Alphabet Inc. (GOOG), in particular. It has consistently remained one of the technology industry’s most-sustainable and most admired companies thanks to its committed leadership and groundbreaking innovations. It’s bid to reduce its carbon footprint has been well received by both younger and older investors.

Alphabet’s approach to the world has helped fuel investor confidence across the board. It’s more than doubled its share price over the past five years, and it’s just getting started. In fact, despite its $1.16 trillion valuation, many analysts still see a major potential for growth.

Fueled by millennial money and the multi-trillion-dollar ESG boom, Tesla Inc. (TSLA) emerged as the stock story of 2020. Throughout the year, the de facto king of electric vehicles dominated headlines and defied expectations. Tesla has continued to defy bearish expectations that low oil prices would put a damper on its core business of selling electric vehicles.

Clearly, its efforts are paying off, as it is without-a-doubt one of the most popular stocks on Wall Street. And though the company saw its share price jump by over 600% in 2020 alone, there is still a lot of upside potential for Musk’s electric vehicle giant. 

The meteoric rise by Tesla stock has seen CEO Elon Musk leapfrog several billionaires including Bill Gates to become the second-richest man on earth with a net worth of $155 billion. And if things keep going the way they’re going, there’s a very good chance that this year, Musk could surpass even Jeff Bezos to become the richest man in the world.

By. Angela Cousins

**IMPORTANT! BY READING OUR CONTENT YOU EXPLICITLY AGREE TO THE FOLLOWING. PLEASE READ CAREFULLY**

Forward-Looking Statements

This publication contains forward-looking information which is subject to a variety of risks and uncertainties and other factors that could cause actual events or results to differ from those projected in the forward-looking statements.  Forward looking statements in this publication include that the demand for ride sharing services will grow; that Steer can help change car ownership in favor of subscription services; that Tracescan could help the travel and tourism industry deal with COVID and will sign new agreements for use of its alert wearables; that new tech deals will be signed by Facedrive and deals signed already will increase company revenues; that Facedrive will be able to expand to the US and globally; that Facedrive’s merchandise business and sports prediction app will prove popular and successful; that Facedrive will be able to fund its capital requirements in the near term and long term; and that Facedrive will be able to carry out its business plans. These forward-looking statements are subject to a variety of risks and uncertainties and other factors that could cause actual events or results to differ materially from those projected in the forward-looking information.  Risks that could change or prevent these statements from coming to fruition include that riders are not as attracted to EV rides as expected; that competitors may offer better or cheaper alternatives to the Facedrive businesses; TraceScan may not work as expected in commercial settings and customers may not acquire or use it; changing governmental laws and policies; the company’s ability to obtain and retain necessary licensing in each geographical area in which it operates; the success of the company’s expansion activities and whether markets justify additional expansion; the ability of the company to attract drivers who have electric vehicles and hybrid cars; the ability of Facedrive to attract providers of good and services for merchandise partnerships on terms acceptable to both parties, and on profitable terms for Facedrive; and that the products co-branded by Facedrive may not be as merchantable as expected. The forward-looking information contained herein is given as of the date hereof and we assume no responsibility to update or revise such information to reflect new events or circumstances, except as required by law.

DISCLAIMERS

This communication is not a recommendation to buy or sell securities. Oilprice.com, Advanced Media Solutions Ltd, and their owners, managers, employees, and assigns (collectively «the Company») owns a considerable number of shares of FaceDrive (FD.V) for investment, however the views reflected herein do not represent Facedrive nor has Facedrive authored or sponsored this article. This share position in FD.V is a major conflict with our ability to be unbiased, more specifically:

This communication is for entertainment purposes only. Never invest purely based on our communication. Therefore, this communication should be viewed as a commercial advertisement only. We have not investigated the background of the featured company. Frequently companies profiled in our alerts experience a large increase in volume and share price during the course of investor awareness marketing, which often end as soon as the investor awareness marketing ceases. The information in our communications and on our website has not been independently verified and is not guaranteed to be correct.

SHARE OWNERSHIP. The owner of Oilprice.com owns a substantial number of shares of this featured company and therefore has a substantial incentive to see the featured company’s stock perform well. The owner of Oilprice.com will not notify the market when it decides to buy more or sell shares of this issuer in the market. The owner of Oilprice.com will be buying and selling shares of this issuer for its own profit. This is why we stress that you conduct extensive due diligence as well as seek the advice of your financial advisor or a registered broker-dealer before investing in any securities.

NOT AN INVESTMENT ADVISOR. The Company is not registered or licensed by any governing body in any jurisdiction to give investing advice or provide investment recommendation. ALWAYS DO YOUR OWN RESEARCH and consult with a licensed investment professional before making an investment. This communication should not be used as a basis for making any investment.

RISK OF INVESTING. Investing is inherently risky. Don’t trade with money you can’t afford to lose. This is neither a solicitation nor an offer to Buy/Sell securities. No representation is being made that any stock acquisition will or is likely to achieve profits.

DISCLAIMER:  OilPrice.com is Source of all content listed above.  FN Media Group, LLC (FNM), is a third party publisher and news dissemination service provider, which disseminates electronic information through multiple online media channels. FNM is NOT affiliated in any manner with OilPrice.com or any company mentioned herein.  The commentary, views and opinions expressed in this release by OilPrice.com are solely those of OilPrice.com and are not shared by and do not reflect in any manner the views or opinions of FNM.  FNM is not liable for any investment decisions by its readers or subscribers.  FNM and its affiliated companies are a news dissemination and financial marketing solutions provider and are NOT a registered broker/dealer/analyst/adviser, holds no investment licenses and may NOT sell, offer to sell or offer to buy any security.  FNM was not compensated by any public company mentioned herein to disseminate this press release.

FNM HOLDS NO SHARES OF ANY COMPANY NAMED IN THIS RELEASE.

This release contains «forward-looking statements» within the meaning of Section 27A of the Securities Act of 1933, as amended, and Section 21E the Securities Exchange Act of 1934, as amended and such forward-looking statements are made pursuant to the safe harbor provisions of the Private Securities Litigation Reform Act of 1995. «Forward-looking statements» describe future expectations, plans, results, or strategies and are generally preceded by words such as «may», «future», «plan» or «planned», «will» or «should», «expected,» «anticipates», «draft», «eventually» or «projected». You are cautioned that such statements are subject to a multitude of risks and uncertainties that could cause future circumstances, events, or results to differ materially from those projected in the forward-looking statements, including the risks that actual results may differ materially from those projected in the forward-looking statements as a result of various factors, and other risks identified in a company’s annual report on Form 10-K or 10-KSB and other filings made by such company with the Securities and Exchange Commission. You should consider these factors in evaluating the forward-looking statements included herein, and not place undue reliance on such statements. The forward-looking statements in this release are made as of the date hereof and FNM undertakes no obligation to update such statements.

Contact Information:
Media Contact e-mail:  editor@financialnewsmedia.com
U.S. Phone: +1(954)345-0611


Cision View original content:http://www.prnewswire.com/news-releases/how-400-year-old-blood-taxis-created-a-5-7-trillion-industry-301200719.html

SOURCE Oilprice.com

With the Support of the Citizenship by Investment Programme, Climate-Resilience is High on Dominica’s 2021 Agenda

LONDON, Jan. 5, 2021 /PRNewswire/ — The small Caribbean island of the Commonwealth of Dominica, which surrounds the Caribbean Sea on one side and the Atlantic Ocean on the other, is working on becoming the world’s first climate-resilient nation. Recently, Prime Minister Dr Roosevelt Skerrit stated that more climate-resilient homes will be constructed in 2021. The goal is part of <span…

LONDON, Jan. 5, 2021 /PRNewswire/ — The small Caribbean island of the Commonwealth of Dominica, which surrounds the Caribbean Sea on one side and the Atlantic Ocean on the other, is working on becoming the world’s first climate-resilient nation. Recently, Prime Minister Dr Roosevelt Skerrit stated that more climate-resilient homes will be constructed in 2021. The goal is part of Dominica’s national housing initiative that aims is to build over 5,000 climate-resilient homes capable of handling any powerful category five catastrophes. Thousands of homes have already been constructed and given to families across the island. 

This massive feat is attributed to the Skerrit administration and its efficient management of funds collected through the island’s Citizenship by Investment Programme. Inevitably, in time, Dominica’s ‘Housing Revolution’ will transform the island, restoring the lives of many while equally preparing for the future despite climate change.

«This is a mission that we are going to continue until every family in the country is in a comfortable home. In 2021, even more, homes will be constructed all across the country,» stated Dominican Prime Minister. «COVID-19 is calling for us to create a kinder, more caring country and world. Perhaps, it should motivate us to construct a world that is more respectful of Mother Earth and the family of humanity,» PM Skerrit added.

The extensive project also demonstrates the transparency of Dominica’s Citizenship by Investment Programme. It remains a tool for empowering the native community, bolstering economic growth and building international relationships as the global community comes together to create structures that will last for many generations. Dominica takes pride in showing exactly where investors’ contributions go.

By contributing to the Economic Diversification Fund under Dominica’s Citizenship by Investment Programme, foreign investors are rewarded with the country’s valuable citizenship. While there is no requirement to reside on the island to qualify for citizenship, all applicants must first pass the Programme’s due diligence checks, ranked second to none in the entire CBI industry. 

According to the CBI Index, published by the Financial Times’ PWM magazine, Dominica remains the best country for citizenship by investment. Alternatively, applicants can invest in pre-approved hotels that are establishing a thriving ecotourism sector on the island.

Contact:
pr@csglobalpartners.com 
www.csglobalpartners.com

Cision View original content:http://www.prnewswire.com/news-releases/with-the-support-of-the-citizenship-by-investment-programme-climate-resilience-is-high-on-dominicas-2021-agenda-301200380.html

SOURCE CS Global Partners

AgroFresh Solutions to Present in the 23rd Annual ICR Virtual Conference

PHILADELPHIA, Jan. 5, 2021 /PRNewswire/ — AgroFresh Solutions, Inc. (Nasdaq: AGFS), a global leader in produce freshness solutions, announced today that its management team, including Jordi Ferre, Chief Executive Officer, and Graham Miao, Chief Financial Officer, will present at the 23rd Annual ICR Virtual Conference, Inc. on Tuesday, January 12, 2021 at 1:30 PM ET. …

PHILADELPHIA, Jan. 5, 2021 /PRNewswire/ — AgroFresh Solutions, Inc. (Nasdaq: AGFS), a global leader in produce freshness solutions, announced today that its management team, including Jordi Ferre, Chief Executive Officer, and Graham Miao, Chief Financial Officer, will present at the 23rd Annual ICR Virtual Conference, Inc. on Tuesday, January 12, 2021 at 1:30 PM ET

The presentation and related materials will be available to all interested parties through a live audio webcast accessible in the investor relations section of AgroFresh’s website at www.agrofresh.com. An archived replay of the webcast will also be available shortly after the live event has concluded.

About AgroFresh

AgroFresh (Nasdaq: AGFS) is a leading global innovator and provider of science-based solutions, data-driven technologies and experience-backed services to enhance the quality and extend the shelf life of fresh produce. For more than 20 years, AgroFresh has been revolutionizing the apple industry and has launched new innovative solutions in a variety of fresh produce categories from bananas to cherries and citrus to pears. AgroFresh supports growers, packers and retailers by providing post-harvest solutions across the industry to enhance crop values while conserving our planet’s resources and reducing global food waste. Visit agrofresh.com to learn more.


Cision View original content to download multimedia:http://www.prnewswire.com/news-releases/agrofresh-solutions-to-present-in-the-23rd-annual-icr-virtual-conference-301200795.html

SOURCE AgroFresh Solutions, Inc.

Home Value Disparities Between Races Are Still Pronounced, but Shrinking

SEATTLE, Jan. 5, 2021 /PRNewswire/ — Typical values for Black- and Latinx-owned homes still lag behind overall U.S. home values, but the gap is narrowing. A new Zillow® <a target="_blank"…

SEATTLE, Jan. 5, 2021 /PRNewswire/ — Typical values for Black- and Latinx-owned homes still lag behind overall U.S. home values, but the gap is narrowing. A new Zillow® analysis shows homes owned by Black and Latinx households are worth 16.2% and 10.2% less, respectively, than the typical U.S. home — gaps that have closed by about 4 percentage points from their widest points following the Great Recession.

Homes owned by non-Hispanic white and Asian families, meanwhile, have typical values 2.9% and 3.7% higher than the typical U.S. home.

While inequity in home values continues to persist, the data show them steadily, albeit slowly, converging. Since homeownership is the single largest driver of wealth for many households, the value and appreciation of a home is extremely impactful for families.

Before the Great Recession, the gap between Black-owned home values and all home values was about 15%, but grew to 20% by March 2014. Similarly, Latinx-owned homes saw the largest home value gap in May 2012 at 14% — 2 percentage points larger than before the housing bubble. Now, nearly a decade later, home values for Black- and Latinx-owned homes are back at pre-bubble levels, and continue to narrow despite the current economic crisis.

One reason for the wide gap is that the housing bust hit communities of color especially hard. Subprime loans were targeted to take advantage of the most vulnerable communities, and the ensuing wave of foreclosures hurt homeownership and home values disproportionately for Black and Latinx homeowners. Fast forward 12 years, and homeownership rates and home values are still recovering for these communities. While home value growth turned positive for U.S. homes in August 2012, it took an additional two years for Black and Latinx homes to see this same growth.

«It has taken nearly a decade for the home value gap to return to pre-recession levels, but still, the gap remains very large,» says Zillow economist Treh Manhertz. «With Black and brown communities and jobs hit disproportionately hard in the pandemic, there has been reason to worry another dip may be on the horizon that could slow or stop the progress. However, this is not the case, as the same factors that widened the gap in the Great Recession are not surfacing this time. Thanks to rock bottom rates on the most secure mortgages, extended forbearance programs, and rising home prices, there are no signs of another widening of the gap coming this year. However, through these turbulent times, continued vigilance and targeted intervention by policymakers is crucial to keep the progress going for communities of color.»

Home value inequality varies greatly in different states and metropolitan areas. Large metros with the smallest spread between Black-owned home values are Riverside (1% value gap), San Antonio (3%), Las Vegas (3%), and Portland (4%). Among the most unequal are Detroit (46% value gap), Buffalo (43%) Birmingham (43%), St. Louis (41%), and Milwaukee (40%).

Black homeownership rates are also on the rise since the Great Recession, despite challenges for Black homebuyers to secure a mortgage. Telework has the ability to expand the opportunity for homeownership even further for Black and Latinx renters, providing the flexibility to own a home in a less-expensive area.

Metropolitan Area*

Zillow Home Value Index

ZHVI for Black-Owned Homes

Home Value Gap for Black-Owned Homes

ZHVI for Latinx-Owned Homes

Home Value Gap for Latinx-Owned Homes

United States

$262,604

$219,931

-16.2%

$235,943

-10.2%

New York/Newark, NY/NJ

$505,569

$444,523

-12.1%

$458,474

-9.3%

Los Angeles, CA

$726,379

$587,679

-19.1%

$551,079

-24.1%

Chicago, IL

$255,532

$159,962

-37.4%

$213,016

-16.6%

Dallas-Fort Worth, TX

$271,831

$221,932

-18.4%

$223,245

-17.9%

Philadelphia, PA

$269,695

$207,440

-23.1%

$218,992

-18.8%

Houston, TX

$229,613

$190,589

-17.0%

$196,079

-14.6%

Washington, DC

$459,656

$430,736

-6.3%

$431,427

-6.1%

Miami-Fort Lauderdale, FL

$312,574

$258,932

-17.2%

$308,280

-1.4%

Atlanta, GA

$255,109

$216,927

-15.0%

$244,280

-4.2%

Boston, MA

$525,223

$443,914

-15.5%

$460,944

-12.2%

San Francisco, CA

$1,126,793

$875,107

-22.3%

$909,903

-19.2%

Detroit, MI

$195,270

$106,413

-45.5%

$154,686

-20.8%

Riverside, CA

$411,728

$407,797

-1.0%

$393,359

-4.5%

Phoenix, AZ

$315,045

$275,568

-12.5%

$254,695

-19.2%

Seattle, WA

$567,205

$478,372

-15.7%

$518,693

-8.6%

Minneapolis-St. Paul, MN

$310,357

$271,748

-12.4%

$288,169

-7.1%

San Diego, CA

$649,474

$529,026

-18.5%

$545,204

-16.1%

St. Louis, MO

$190,720

$112,529

-41.0%

$183,594

-3.7%

Tampa, FL

$240,308

$211,518

-12.0%

$230,762

-4.0%

Baltimore, MD

$311,464

$269,153

-13.6%

$290,738

-6.7%

Denver, CO

$468,128

$412,917

-11.8%

$430,108

-8.1%

Pittsburgh, PA

$174,771

$137,005

-21.6%

$224,108

28.2%

Portland, OR

$442,464

$426,583

-3.6%

$421,170

-4.8%

Charlotte, NC

$259,012

$218,607

-15.6%

$235,254

-9.2%

Sacramento, CA

$458,805

$424,437

-7.5%

$431,496

-6.0%

San Antonio, TX

$223,830

$216,275

-3.4%

$198,868

-11.2%

Orlando, FL

$268,806

$242,226

-9.9%

$259,484

-3.5%

Cincinnati, OH

$203,768

$166,450

-18.3%

$207,243

1.7%

Cleveland, OH

$168,994

$101,824

-39.7%

$134,180

-20.6%

Kansas City, MO

$220,301

$163,397

-25.8%

$185,913

-15.6%

Las Vegas, NV

$305,073

$294,656

-3.4%

$274,878

-9.9%

Columbus, OH

$225,835

$174,351

-22.8%

$209,033

-7.4%

Indianapolis, IN

$200,366

$179,633

-10.3%

$178,652

-10.8%

San Jose, CA

$1,236,298

$1,120,585

-9.4%

$951,612

-23.0%

Austin, TX

$366,297

$294,580

-19.6%

$313,708

-14.4%

Virginia Beach, VA

$259,731

$245,226

-5.6%

$254,769

-1.9%

Nashville, TN

$297,996

$269,767

-9.5%

$278,214

-6.6%

Providence, RI

$342,548

$308,388

-10.0%

$309,296

-9.7%

Milwaukee, WI

$202,012

$121,715

-39.7%

$165,441

-18.1%

Jacksonville, FL

$246,484

$193,905

-21.3%

$244,903

-0.6%

Memphis, TN

$167,904

$124,538

-25.8%

$145,730

-13.2%

Oklahoma City, OK

$171,213

$142,051

-17.0%

$131,541

-23.2%

Louisville, KY

$192,122

$141,855

-26.2%

$174,852

-9.0%

Hartford, CT

$250,566

$205,037

-18.2%

$216,184

-13.7%

Richmond, VA

$261,415

$234,525

-10.3%

$250,052

-4.3%

New Orleans, LA

$217,016

$179,157

-17.4%

$213,635

-1.6%

Buffalo, NY

$187,090

$106,690

-43.0%

$163,008

-12.9%

Raleigh, NC

$299,764

$253,661

-15.4%

$272,773

-9.0%

Birmingham, AL

$184,012

$105,272

-42.8%

$172,171

-6.4%

Salt Lake City, UT

$418,763

$395,093

-5.7%

$358,700

-14.3%

*Table ordered by market size

About Zillow Group:
Zillow Group, Inc. (NASDAQ: Z and ZG) is reimagining real estate to make it easier to unlock life’s next chapter.

As the most-visited real estate website in the U.S., Zillow® and its affiliates offer customers an on-demand experience for selling, buying, renting or financing with transparency and nearly seamless end-to-end service. Zillow Offers® buys and sells homes directly in dozens of markets across the country, allowing sellers control over their timeline. Zillow Home Loans™, our affiliate lender, provides our customers with an easy option to get pre-approved and secure financing for their next home purchase. Zillow recently launched Zillow Homes, Inc., a licensed brokerage entity, to streamline Zillow Offers transactions. 

Zillow Group’s affiliates and subsidiaries include Zillow®, Zillow Offers®, Zillow Premier Agent®, Zillow Home Loans™, Zillow Closing Services™, Zillow Homes, Inc., Trulia®, Out East®, StreetEasy® and HotPads®. Zillow Home Loans, LLC is an Equal Housing Lender, NMLS #10287 (www.nmlsconsumeraccess.org).

Cision View original content to download multimedia:http://www.prnewswire.com/news-releases/home-value-disparities-between-races-are-still-pronounced-but-shrinking-301200644.html

SOURCE Zillow

Funding the Future of Agriculture: FarmTogether Enrolls 100% of its Acres in Leading Harvest’s Sustainable Farmland Management Standard

SAN FRANCISCO, Jan. 5, 2021 /PRNewswire/ — FarmTogether, the technology-powered, online marketplace providing…

SAN FRANCISCO, Jan. 5, 2021 /PRNewswire/ — FarmTogether, the technology-powered, online marketplace providing investors with direct access to farmland ownership, today announced that it has committed 100% of its acres to certify to the Leading Harvest Farmland Management Standard, the first scalable, industry-wide standard paving the way for universal sustainable farmland management. FarmTogether’s commitment to Leading Harvest advances its efforts to prioritize long-term stewardship for both its investors and future generations.

Leading Harvest’s standard certification program provides the framework for simple and widespread adoption of sustainable farmland management through a set of meaningful, certifiable, and measurable stewardship results. The outcomes-based program, which can be applied across all crops and geographies, covers Thirteen Objectives spanning the environmental, social, and economic issues facing Earth today–ranging from soil health, energy use, air quality, water management, and fair labor, to reducing impacts on climate change. Each Objective consists of Performance Measures and Indicators that provide specific guidance for reporting and compliance, certified through a rigorous, third-party auditing process. 

«FarmTogether recognizes the enormous potential of sustainable farmland management practices. After years of careful consideration, research, and broad stakeholder engagement, Leading Harvest has created a standard that encapsulates the breadth and depth of measurable sustainable farmland management practices,» said David Chan, COO of FarmTogether. «We are excited to partner with a thought leader like Leading Harvest to advance the adoption of sustainable agriculture.»

With the global population expected to hit an all-time peak of 9.7 billion by 2050, farmers are experiencing stark increases in the demand for food. With limited arable land and the progression of climate change threatening the traditional supply of natural resources, the challenge to feed a growing population is exacerbated. However, research shows that through effective farmland management and by utilizing sustainable approaches and regenerative farming, farm operations could double or triple their yields without clearing additional acreage.

FarmTogether embraces sustainable farmland management and making long-term, positive changes to the planet and future communities. By directly investing in farmland with FarmTogether, investors are funding innovative and sustainable farming practices and driving real solutions to climate change while earning strong returns in the process.

«Leading Harvest provides programs that offer a more rational, credible, and scalable approach to sustainability assurance and verification. We are thrilled to partner with organizations, like FarmTogether, that are at the leading edge of agricultural sustainability and represent new models for the future of the industry,» said Kenny Fahey, Executive Director of Leading Harvest. «FarmTogether’s commitment to technology-enabled investing that creates financial returns through sustainable management demonstrates that economic, social, and environmental outcomes go hand-in-hand.»

To learn more about FarmTogether and its current properties, please visit farmtogether.com.

About FarmTogether

FarmTogether is a technology-powered, online marketplace that enables individuals to invest in U.S. farmland. The company has developed an end-to-end platform that allows investors to browse carefully vetted farmland investments, review due diligence materials, invest in properties, and sign legal documents, all in a secure online environment. FarmTogether’s team and partners are cross-industry professionals with over 70 years of experience across farmland investing, agriculture, and real estate in the U.S. and globally.

About Leading Harvest

Leading Harvest is a new nonprofit organization at the vanguard of sustainable agriculture. It launched in April of 2020 with over 2 million U.S. acres committed to its platform. Leading Harvest’s inaugural product is a first-ever universal outcomes-based certification program. It verifies that farmland is being managed sustainably through outcomes-based evidence and third-party audits. For Leading Harvest, sustainability means best-in-class performance across all environmental, social, and economic issues, from soil health to climate change, from community well-being to safe and fair working conditions for farm laborers. Leading Harvest offers solutions to grow confidently, together.

CONTACT: Rebecca Bauer, rebecca.bauer@farmtogether.com


Cision View original content to download multimedia:http://www.prnewswire.com/news-releases/funding-the-future-of-agriculture-farmtogether-enrolls-100-of-its-acres-in-leading-harvests-sustainable-farmland-management-standard-301200763.html

SOURCE FarmTogether

Grist Mill Bridge Open to Traffic with AIT Bridges Composite Beams

BREWER, Maine, Jan. 5, 2021 /PRNewswire-PRWeb/ — AIT Bridges, a division of Advanced Infrastructure Technologies (AIT), a designer and supplier of composite bridge systems and structural components, announced that, in conjunction with The Maine Department of Transportation, after the December 31st

BREWER, Maine, Jan. 5, 2021 /PRNewswire-PRWeb/ — AIT Bridges, a division of Advanced Infrastructure Technologies (AIT), a designer and supplier of composite bridge systems and structural components, announced that, in conjunction with The Maine Department of Transportation, after the December 31st load testing, the replacement of the Grist Mill Bridge has opened to traffic, located on Route 1A , in Hampden Maine.

The former span was constructed in 1950 and was comprised of three bridges built one on top of the another. It has been replaced with a new span consisting of five composite beams manufactured at AIT Bridge’s Brewer, Maine facility. The technology was developed in cooperation with The University of Maine’s Advanced Structures and Composites Center.

The Grist Mill Bridge spans over the Souadabscook Stream which is an environmentally sensitive tributary of the Penobscot River. This bridge replacement is part of a project that includes reconstruction and paving work on an almost two-mile-long stretch of Route 1A. The total cost for the project is approximately $8.9 million.

AIT Bridges’ composite bridge systems are designed to last over 100 years, at least 30 years longer than the average steel bridge. Additionally, because its bridge systems use composites instead of steel, they need little to zero maintenance over their lifecycle. The use of sustainable, environmentally friendly (low carbon footprint) materials results in a low impact solution to the aging bridges in the U.S.

AIT Bridges would like to thank the Maine businesses and agencies that helped make this historic project possible: MaineDOT, UMaine’s Advanced Structures and Composite Center, T Buck Construction, Dashiell Transportation, TY Lin International (Falmouth, Maine Office), Calderwood Engineering, Composites One LLC (Rockland, Maine Distributor), TexTech Industries, Portland Bolt, N.S. Giles Foundation, Inc., Lee’s Concrete, Owen J. Folsom, Inc., and Hammond Lumber.

«We’re so pleased to have lent our engineering expertise to the replacement of the Grist Mill Bridge in Hampden,» said Ken Sweeney, President and Chief Engineer, AIT Bridges. «We wanted to ensure that the construction that took place in 2020 would be long lasting and resilient. By using materials made in Maine by Maine craftspeople, this bridge will stand the test of time.»

Today, AIT Bridges offers the composite arch bridge system and composite beams; two building blocks capable of replacing most bridges across the country. For more information about AIT Bridges, please visit: https://www.aitbridges.com

# # #

About AIT Bridges
AIT Bridges, a division of Advanced Infrastructure Technologies, is the leading producer of innovative composite bridge solutions, providing a unique tailored customer experience. We aim to provide cost-effective and high-quality composite bridge solutions to meet today’s complex design, durability, and environmental challenges.

Our systems utilize components from the ‘Bridge-in-a-Backpack’ technology, developed over an 11+ year period by the Advanced Structures and Composites Center at the University of Maine. The goal was to develop a rapidly deployable bridge technology for the military. In 2008, Advanced Infrastructure Technologies (AIT) was formed to commercialize the inflatable arch technology. AIT Bridges expanded the composite product line and designed a composite tub beam system built from the original technology. The resulting composite tub beam bridge system utilizes advanced composites materials to produce a rapidly constructed bridge system that offers an extended lifespan with little to no maintenance.

Media Contact

Joanne Hogue, Smart Connections PR for AIT Bridges, 410-658-8246, joanne@smartconnectionspr.com


SOURCE AIT Bridges

Tyrata Launches Tyrata.io–a Data Portal for Real-time Monitoring of Tread Wear in Vehicle Fleets

DURHAM, N.C., Jan. 5, 2021 /PRNewswire/ — Tyrata, Inc., a tire sensor and data management company, announces Tyrata.io, a cloud-based, comprehensive data portal for its IntelliTread™ tire tread monitoring products.  Tyrata.io is an easy-to-use, interactive portal that works in combination with Tyrata’s Drive-Over System (DOS) to provide direct tire measurement and real-time tread wear analysis for large vehicle fleets. The system fully automates tread depth measurements and analytics needed for…

DURHAM, N.C., Jan. 5, 2021 /PRNewswire/ — Tyrata, Inc., a tire sensor and data management company, announces Tyrata.io, a cloud-based, comprehensive data portal for its IntelliTread™ tire tread monitoring products.  Tyrata.io is an easy-to-use, interactive portal that works in combination with Tyrata’s Drive-Over System (DOS) to provide direct tire measurement and real-time tread wear analysis for large vehicle fleets. The system fully automates tread depth measurements and analytics needed for efficient tire-management and safe vehicle operation. The solution has no hardware cost and is deployed within hours with no impact to current fleet operations. 

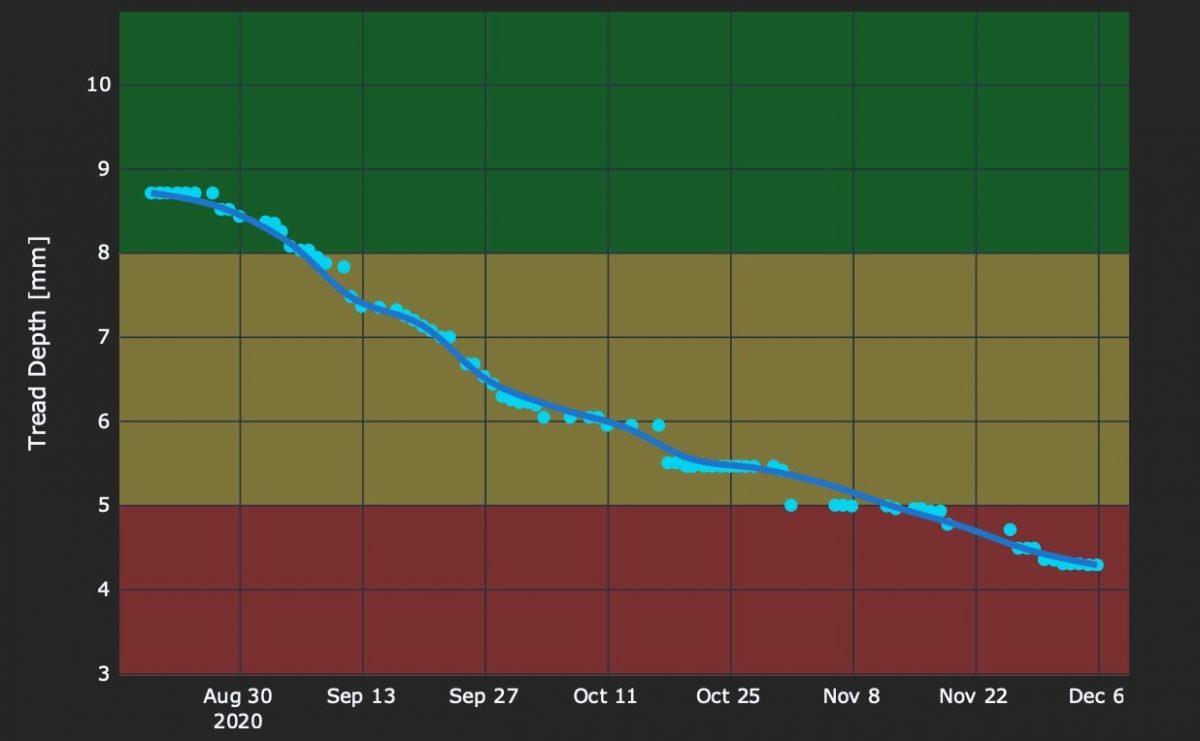
The IntelliTread™ Drive-Over System was developed based on the unmet need for low-cost, easy-to-deploy tire tread monitoring in both passenger and commercial vehicle fleets. The Drive-Over System collects tire tread wear data when a vehicle drives over a speedbump-like unit that is now linked to Tyrata.io, a cloud-based data analytics platform to inform service and depot managers about the actual condition of their tires in real time.

By logging into their account at Tyrata.io, fleet operators will open a secure data portal where they can monitor the health of any individual tire with an ability to obtain instant tire history and analytics at a click of a button.  Operators can also get comprehensive, fleet-wide tire wear status and service recommendations for optimized tire maintenance and optimal vehicle safety.

Regular tire tread monitoring enhances data accuracy and provides clear tread wear trends, allowing the fleet operator to focus on tires that require service. With a DOS deployed at a vehicle service depot, Tyrata’s new data portal provides intuitive visualization of tire condition of the entire fleet, along with a daily or weekly report on any tires requiring maintenance.  Predictive analytics are also available for improved management of tires across the fleet. Outputs from the data portal can also be integrated with customer’s existing reporting and maintenance systems.

«The Tyrata data portal provides comprehensive tire data management, data visualization and maintenance analytics that is very easy for our customers to use,» said Luka Lojk, Tyrata’s VP of Sales and Marketing. «Within a few hours of deployment, our customers can be up and running, collecting tread data on all their vehicles, with no impact on fleet operations, positioning them to make data-driven maintenance decisions that optimize resources and improve safety.»

For a brief demonstration of Tyrata’s data portal, visit the Tyrata website at Tyrata.com.

Companies wishing to qualify and deploy DOS in Europe may contact Tyrata at Tyrata.Europe@Tyrata.com. In Japan, organizations may contact our local representative at Tyrata.Japan@Tyrata.com. For the USA and other global regions, contact Luka Lojk at Luka.Lojk@Tyrata.com or +1-704-593-8418 for more information.

About Tyrata
Tyrata, Inc., is a tire sensor and data management company offering tire monitoring solutions for fleet managers, tire manufacturers and automotive service centers. The company’s IntelliTread™ technology monitors, tracks and predicts tire tread life, delivering direct measurements of tread depth in real-time. Solid-state sensors are linked to cloud-based data management and analytics to warn drivers, service advisors and depot managers when tires are dangerously thin. Tyrata is dedicated to improving tire safety, reducing maintenance costs, enhancing sustainability and increasing profitability for its customers. For more information, visit www.tyrata.com.

Contact:
Garth Miller, All Business Marketing, LLC
919-424-0090 (office)
919-923-3505 (mobile)
288469@email4pr.com

Cision View original content to download multimedia:http://www.prnewswire.com/news-releases/tyrata-launches-tyrataioa-data-portal-for-real-time-monitoring-of-tread-wear-in-vehicle-fleets-301201031.html

SOURCE Tyrata

Summa Silver Provides Annual Update Letter from CEO

VANCOUVER, BC, Jan. 5, 2021 /PRNewswire/ – Summa Silver Corp. («Summa Silver» or the «Company») (CSE: SSVR) (OTCQB: SSVRF) (Frankfurt: 48X) is pleased to provide the following letter to all shareholders from the CEO.

Dear Shareholders and Investors,

This past year marked a strong debut year for Summa Silver. After listing in February, the Company quickly optioned two high-quality silver and gold exploration properties in under-appreciated historic mining…

VANCOUVER, BC, Jan. 5, 2021 /PRNewswire/ – Summa Silver Corp. («Summa Silver» or the «Company») (CSE: SSVR) (OTCQB: SSVRF) (Frankfurt: 48X) is pleased to provide the following letter to all shareholders from the CEO.

Dear Shareholders and Investors,

This past year marked a strong debut year for Summa Silver. After listing in February, the Company quickly optioned two high-quality silver and gold exploration properties in under-appreciated historic mining districts in the United States and raised $13M in two private placements.

Our highest priority is to create shareholder value through systematic exploration of our two highly prospective silver and gold projects.

Highlights from 2020

Aggressive drilling at the Hughes Property in Nevada was the central focus of our exploration strategy in 2020. Originally budgeted for 7,500 m of drilling in 15 holes, our first ever drill program was expanded and ultimately consisted of 14,460 m of drilling in 29 holes.

Key takeaways from the 2020 Hughes drill program include:

  • High-grade silver and gold mineralization was discovered in four target areas across a 3.5 km trend.
  • The area around the historic Belmont Mine hosts numerous well mineralized and unmined veins.
  • The Ruby discovery may represent a 1.3 km extension of the Tonopah district to the east
  • The Murray area hosts broad zones of mineralization that likely cross the property boundary to the west onto Blackrock Gold Corp’s Tonopah West Property.
  • Assays for 14 holes remain pending, all of which intersected quartz veins and breccias.

In addition to the Hughes Property, the Company also optioned a large portion of the historic Mogollon mining district near Silver City, New Mexico. Undrilled since the 1980’s, historical drill results outline a target area at the old Consolidated Mine. The target spans 500 x 200 m where 8 historic drill holes are reported to have averaged 497 g/t silver equivalent over average drilled lengths of 13.3 m. Taking a step back and looking at the bigger picture, this Consolidated Mine target represents approximately 0.6 km of the 34 km of cumulative structure/vein length on the property. Putting those numbers into context, the Consolidated Mine target represents less than 2% of the prospective target horizons on the property.

Outlook for 2021

It is very clear to us at Summa Silver that both the Hughes and Mogollon properties warrant significant drill programs in 2021 as we drive towards mineral resource estimates at both projects. With that in mind, we are planning a two-faceted approach to unlock value for shareholders in 2021.

  1. At the Hughes property, follow up drilling at all four of the original target areas is required and we will systematically drill step out holes around areas of known mineralization. We are also planning a geological mapping and sampling program covering the large, but under-documented zones of hydrothermal alteration on the northern and eastern portions of the property.
  2. At the Mogollon property, the Consolidated Mine target area clearly warrants a thorough mineral resource assessment via a pattern of grid drilling.  Permits for this drill program are expected in Q1. We are also planning boots-on-the-ground geological mapping and sampling program to gain a better understanding of the geologic controls on silver and gold mineralization.

Looking back to the beginning of 2020, Summa Silver was just an idea. I’m very grateful to our supportive shareholders who are integral to our success. I’m also very pleased with how far we’ve come in one short year and look forward to using our geological expertise to create further shareholder value in 2021.

At Summa Silver, we strive to communicate our corporate message with transparency and consistency with the public market community and we urge you to reach out to allow us to get to know our shareholders better.

Follow Summa Silver on Twitter: @summasilver
LinkedIn:
https://www.linkedin.com/company/summa-silver-corp/ 
ON BEHALF OF THE BOARD OF DIRECTORS
«Galen McNamara»
Galen McNamara, Chief Executive Officer
info@summasilver.com
www.summasilver.com

Investor Relations Contact:
Kin Communications
Arlen Hansen
604-684-6730
SSVR@kincommunications.com

Qualified Person

The technical content of this news release has been reviewed and approved by Galen McNamara, P. Geo., the CEO of the Company, and a qualified person as defined by National Instrument 43-101.

About Summa Silver Corp
Summa Silver Corp is a Canadian junior mineral exploration company. The Company has options to earn 100% interests in the Hughes property located in central Nevada and the Mogollon property located in southwestern New Mexico. The Hughes property is host to the high-grade past-producing Belmont Mine, one of the most prolific silver producers in the United States between 1903 and 1929. The Mogollon property features a number of high-grade past-producing mines which operated between the 1880’s and 1942.

The CSE has neither approved nor disapproved the contents of this news release. Neither the CSE nor its Regulation Services Provider (as that term is defined in the policies of the CSE) accepts responsibility for the adequacy or accuracy of this release.

Cautionary note regarding forward-looking statements

This news release contains certain «forward looking statements» and certain «forward-looking information» as defined under applicable Canadian and U.S. securities laws. Forward-looking statements and information can generally be identified by the use of forward-looking terminology such as «may», «will», «should», «expect», «intend», «estimate», «anticipate», «believe», «continue», «plans» or similar terminology. The forward-looking information contained herein is provided for the purpose of assisting readers in understanding management’s current expectations and plans relating to the future. These forward–looking statements or information relate to, among other things: the exploration and development of the Company’s mineral exploration projects.

Forward-looking information is subject to known and unknown risks, uncertainties and other factors that may cause the actual actions, events or results to be materially different from those expressed or implied by such forward-looking information, including but not limited to: the requirement for regulatory approvals; enhanced uncertainty in global financial markets as a result of the current COVID-19 pandemic; unquantifiable risks related to government actions and interventions; stock market volatility; regulatory restrictions; and other related risks and uncertainties.

Forward-looking information are based on management of the parties’ reasonable assumptions, estimates, expectations, analyses and opinions, which are based on such management’s experience and perception of trends, current conditions and expected developments, and other factors that management believes are relevant and reasonable in the circumstances, but which may prove to be incorrect.

The Company undertakes no obligation to update forward-looking information except as required by applicable law. Such forward-looking information represents management’s best judgment based on information currently available. No forward-looking statement can be guaranteed and actual future results may vary materially. Accordingly, readers are advised not to place undue reliance on forward-looking statements or information.

Cision View original content to download multimedia:http://www.prnewswire.com/news-releases/summa-silver-provides-annual-update-letter-from-ceo-301200786.html

SOURCE Summa Silver Corp.

CME Group Reports 2020 Annual, Q4 and Monthly Market Statistics

CHICAGO, Jan. 5, 2021 /PRNewswire/ — CME Group, the world’s leading and most diverse derivatives marketplace, today reported its full-year, Q4 and December market statistics, showing it reached average daily volume (ADV) of 19.1 million contracts during the year, 16.2 million contracts during the fourth quarter, and 14.2 million…

CHICAGO, Jan. 5, 2021 /PRNewswire/ — CME Group, the world’s leading and most diverse derivatives marketplace, today reported its full-year, Q4 and December market statistics, showing it reached average daily volume (ADV) of 19.1 million contracts during the year, 16.2 million contracts during the fourth quarter, and 14.2 million contracts during the month of December. Market statistics are available in greater detail at https://cmegroupinc.gcs-web.com/monthly-volume.

Full-year 2020 highlights across asset classes include:

  • Record Equity Index futures and options ADV of 5.6 million contracts, up 63% over 2019
    • Record E-mini S&P 500 futures and options ADV of 2.7M contracts
    • Record E-mini Micro futures and options ADV of 1.8M contracts
    • Record E-mini Nasdaq 100 futures and options ADV of 585,000 contracts
  • Record Metals futures and options ADV of 699,000 contracts
  • Record Natural Gas futures and options ADV of 639,000 contracts
  • Interest Rate futures and options records including:
    • Record Ultra 10-Year U.S. Treasury Note ADV of 255,320 contracts
    • Record Ultra U.S. Treasury Bond ADV of 207,200 contracts
    • Record SOFR ADV of 51,000 contracts
  • Record Soybean Oil futures and options ADV of 141,000 contracts

Q4 2020 highlights across asset classes include:

  • Record Micro E-mini Equity Index futures and options ADV of 2 million contracts, representing a 332% increase in ADV over Q4 2019
    • Record Micro E-mini Nasdaq 100 futures ADV of 871,000 contracts
  • Record regional Agricultural products ADV:
    • EMEA Agricultural ADV of 289,000 contracts per day
    • APAC Agricultural ADV of 112,000 contracts per day
  • Record SOFR futures ADV of 69,000 contracts per day
  • Record Soybean Oil options ADV of 18,000 contracts per day

December 2020 ADV across asset classes includes:

Additional December product highlights include:

  • Equity Index ADV grew 30% from December 2019
    • Micro E-mini Equity Index futures ADV of 1.7M. Micro E-mini futures and options represented 36.3% of overall Equity Index ADV during December 2020
    • E-mini Nasdaq 100 futures and options rose 17% from December 2019
  • Bitcoin futures and options ADV grew 117% from December 2019
  • SOFR futures ADV increased 91% from December 2019
  • Ultra 10-Year Treasury Note futures rose 13% from December 2019
  • U.S. Treasury Bond futures grew 14% from December 2019
  • Agricultural futures and options ADV rose 13% from December 2019, including 62% agricultural options ADV growth
    • Corn options ADV grew 115% from December 2019
    • Record Soybean Oil options ADV rose 93% from December 2019
  • Silver futures ADV grew 21% from December 2019
  • Micro Gold futures ADV of 73,000 contracts, represented 15.1% of overall Metals ADV during December 2020
  • BrokerTec European repo average daily notional value (€) increased 5% from December 2019
  • EBS spot FX average daily notional value ($) increased 3% from December 2019

As the world’s leading and most diverse derivatives marketplace, CME Group (www.cmegroup.com) enables clients to trade futures, options, cash and OTC markets, optimize portfolios, and analyze data – empowering market participants worldwide to efficiently manage risk and capture opportunities. CME Group exchanges offer the widest range of global benchmark products across all major asset classes based on interest ratesequity indexesforeign exchangeenergyagricultural products and metals.  The company offers futures and options on futures trading through the CME Globex® platform, fixed income trading via BrokerTec and foreign exchange trading on the EBS platform. In addition, it operates one of the world’s leading central counterparty clearing providers, CME Clearing. With a range of pre- and post-trade products and services underpinning the entire lifecycle of a trade, CME Group also offers optimization and reconciliation services through TriOptima, and trade processing services through Traiana.

CME Group, the Globe logo, CME, Chicago Mercantile Exchange, Globex, and, E-mini are trademarks of Chicago Mercantile Exchange Inc.  CBOT and Chicago Board of Trade are trademarks of Board of Trade of the City of Chicago, Inc.  NYMEX, New York Mercantile Exchange and ClearPort are trademarks of New York Mercantile Exchange, Inc.  COMEX is a trademark of Commodity Exchange, Inc. BrokerTec, EBS, TriOptima, and Traiana are trademarks of BrokerTec Europe LTD, EBS Group LTD, TriOptima AB, and Traiana, Inc., respectively. Dow Jones, Dow Jones Industrial Average, S&P 500 and S&P are service and/or trademarks of Dow Jones Trademark Holdings LLC, Standard & Poor’s Financial Services LLC and S&P/Dow Jones Indices LLC, as the case may be, and have been licensed for use by Chicago Mercantile Exchange Inc.  All other trademarks are the property of their respective owners. 

CME-G

Cision View original content:http://www.prnewswire.com/news-releases/cme-group-reports-2020-annual-q4-and-monthly-market-statistics-301200792.html

SOURCE CME Group

Growing Awareness Regarding Environmental Issues Drives Demand Avenues in Biodegradable Water Bottles Market: TMR

ALBANY, N.Y, Jan. 5, 2021 /PRNewswire/ — Remarkable growth in the use of plastics in worldwide locations has resulted into rising environmental concerns. In recent few years, there is considerable growth in awareness about the importance of conservation of environment. Owing to this factor, major population across the global is inclined toward the use of environmental-friendly products. This factor is generating prominent sales opportunities in the global <a target="_blank"…

ALBANY, N.Y, Jan. 5, 2021 /PRNewswire/ — Remarkable growth in the use of plastics in worldwide locations has resulted into rising environmental concerns. In recent few years, there is considerable growth in awareness about the importance of conservation of environment. Owing to this factor, major population across the global is inclined toward the use of environmental-friendly products. This factor is generating prominent sales opportunities in the global biodegradable water bottles market.

Transparency Market Research

Analysts at TMR are of the opinion that the global biodegradable water bottles market will grow at 4.5% CAGR during the assessment period of 2020 to 2030.

Download PDF Brochure https://www.transparencymarketresearch.com/sample/sample.php?flag=B&rep_id=73441

Biodegradable Water Bottles Market: Major Takeaways

  • Growing Environmental Concerns Push Demand for Biodegradable Water bottles

Companies working in the global biodegradable water bottles market are using various plants such as algae, bamboo, pulp, sugarcane, and paper for manufacturing their products. Apart from this, biodegradable plastic such as starch-based plastics, polylactic acid (PLA), polyhydroxyalkanoates (PHA), polyhydroxybutyrate (PHB), and poly-butylene succinate (PBS) are widely used in the production of these bottles. The specialty of all these materials is that they are easily decomposed in the soil in less than 100 days. This factor is attracting major environment enthusiasts toward purchasing biodegradable water bottles, thereby generating prominent sales opportunities in the global biodegradable water bottles market.

The production of biodegradable water bottles requires less water than the production of plastic bottles. Apart from this, there is no emission of carbon during the production of biodegradable water bottles. This scenario highlights the environmental-friendly nature of biodegradable water bottles.

  • Players Focus on Technological Advancements

Major enterprises working in the global biodegradable water bottles market are growing focus toward incorporation of technological advancements during their production activities. They are pouring efforts toward designing biodegradable bottles that look exactly similar to plastic bottles and attract additional customer base. This scenario depicts that the global biodegradable water bottles market will show expansion at promising pace in the forthcoming years.

Explore 180 pages of top-notch research, incisive insights, and detailed country-level projections on Biodegradable Water Bottles Market (Capacity: 15 ml – 100 ml, 101 ml – 500 ml, 501 ml -1000 ml , and Above 1000 ml; Material Type: Organic Material [Paper, Sugarcane Pulp, Bamboo, and Algae] and Biodegradable Plastic [Polylactic Acid {PLA}, Starch-based Plastics, Poly-butylene Succinate [PBS], and Others; and End Use: Residential Use, Institutional Use, and Specialty Purpose [Sports, Travel, and Gym]) – Global Industry Analysis, Size, Share, Growth, Trends, and Forecast, 2020-2030 at https://www.transparencymarketresearch.com/biodegradable-water-bottles-market.html

Biodegradable Water Bottles Market: Growth Boosters

  • The government bodies of many countries across the globe are employing various stringent regulations regarding the conservation of environment. Apart from this, they are introducing diverse favorable policies. These factors are working in favor of the global biodegradable water bottles market.
  • Many enterprises in the global biodegradable water bottles market are focused on strengthening their product portfolio. As a result, they are increasing new product launch activities. This factor is likely to offer promising expansion opportunities for the market for biodegradable water bottles in the years ahead.
  • Several players in the global market for biodegradable water bottles are experimenting with the packaging of their products. The main focus is at providing attractive as well as convenient packaging. This scenario is indication of the promising growth of the global biodegradable water bottles market in the years ahead.

Analyze global biodegradable water bottles market growth in 30+ countries including US, Canada, Germany, United Kingdom, France, Italy, Russia, Poland, Benelux, Nordic, China, Japan, India, and South Korea. Request a sample of the study

Biodegradable Water Bottles Market: Well-Established Participants

Some of the important company profiles covered in report on the biodegradable water bottles market are:

  • Choose Water
  • Paper water bottle
  • Raepack Ltd.
  • Lyspackaging
  • Montana Private Reserve
  • Ecologic Brands Inc.
  • Just Water
  • Mitsubishi Chemicals (MCPP)
  • Cove

Request the Covid19 Impact Analysis at https://www.transparencymarketresearch.com/sample/sample.php?flag=covid19&rep_id=73441

Explore Transparency Market Research’s award-winning coverage of the Global Packaging Industry:

PET Bottles Market – The demand within the global PET bottles market is rising on account of advancements in the domain of plastic manufacturing, a thorough analysis by Transparency Market Research (TMR) reveals that the global PET bottles market is growing at a robust pace in recent times.

Container Glass Market – The demand for container glass has witnessed a huge demand in recent years as the focus towards sustainability has intensified. Container glass is used for making glass containers, which are ideal for storing perishable goods as well as nonperishable ones.

About Transparency Market Research

Transparency Market Research is a global market intelligence company, providing global business information reports and services. Our exclusive blend of quantitative forecasting and trends analysis provides forward-looking insight for thousands of decision makers. Our experienced team of analysts, researchers, and consultants use proprietary data sources and various tools and techniques to gather and analyse information.

Our data repository is continuously updated and revised by a team of research experts, so that it always reflects the latest trends and information. With a broad research and analysis capability, Transparency Market Research employs rigorous primary and secondary research techniques in developing distinctive data sets and research material for business reports.

Contact

Mr Rohit Bhisey
Transparency Market Research
State Tower,
90 State Street,                                                                                                                
Suite 700,
Albany NY – 12207
United States
USA – Canada Toll Free: 866-552-3453
Email: sales@transparencymarketresearch.com
Website: http://www.transparencymarketresearch.com 
Press Release Source: https://www.transparencymarketresearch.com/pressrelease/biodegradable-water-bottles-market.htm 

Cision View original content:http://www.prnewswire.com/news-releases/growing-awareness-regarding-environmental-issues-drives-demand-avenues-in-biodegradable-water-bottles-market-tmr-301200902.html

SOURCE Transparency Market Research