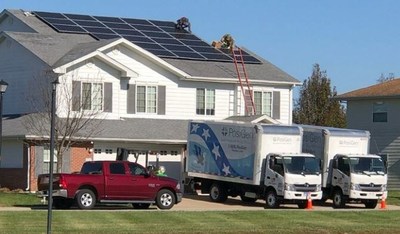
EL PASO, Texas, Jan. 6, 2021 /PRNewswire/ — Hunt Military Communities (HMC), the largest U.S. military housing owner, today announced its project to expand on its leading initiatives to integrate additional solar rooftop photovoltaic (PV) systems across its facility at Scott Air Force Base. This community includes more than 1,500 homes serving 3,000 residents. The 2.8 megawatt PV system will produce an estimated 3.5 million kilowatt-hours of electricity annually and will enable the community to draw 15-20% of its total electricity supply from clean, renewable energy. With this update, HMC has added more than 20 MW of solar across its housing communities nationwide. The project is slated to be completed by Q4 of 2021.
«Hunt Military Communities is wholly dedicated to ensuring that our communities are operating efficiently and with a minimal environmental impact,» said John Hoyt, Vice President of Hunt Military Communities. «Through the deployment of solar energy systems, we can help reduce energy costs and reinvest those resources into our communities, reaffirming our commitment to military families across the United States. We value the partnership with the Department of the Air Force in championing sustainability and the significant support of Scott’s military leadership.»
The installation of the rooftop PV systems will be built and operated by affiliates of True Green Capital Management (TGC), Hunt’s solar energy partner with whom HMC has installed ~12 megawatts of solar projects across six military housing sites. «We are honored to partner with Hunt and the Air Force to provide Scott Air Force Base residents with renewable and resilient energy supply right at their homes», said Dr. Ninios, TGC’s Managing Partner. These PV systems will further reduce Scott’s environmental impact and carbon footprint, ultimately decreasing reliance on non-renewable energy sources. The project directly supports goals set forth by the Department of Defense, as well as the state of Illinois’ goal to achieve 100% renewable energy by the year 2050. For HMC, this is the next step in a broad-based effort to improve the sustainability of military housing nationwide. Col. J. Scot Heathman, Scott Air Force Base installation commander said, «We are very proud of our Scott Family Housing partner, Hunt, for taking this next step in providing sustainable energy for our base housing. Reducing our greenhouse gas footprint while providing economical electricity is a win-win for the installation. We look forward to years of renewable energy production right here at Scott Air Force Base.»
Please visit www.scottfamilyhousing.com to learn more about this PV project and Hunt Military Communities’ commitment to sustainability.
About Hunt Military Communities
Hunt Military Communities, the largest military housing owner, offers unsurpassed quality and service to more than 165,000 residents in approximately 52,000 homes on Navy, Air Force, Marine Corps, and Army installations across the USA. We do this through our core values: safety, kindness, efficiency, enthusiasm, and selflessness, and our 5-Star Service commitment. With a 50-year legacy and a partnership with the Department of Defense, HMC strives to ensure the integrity of our military communities and the families who live there. For more information, visit www.huntmilitarycommunities.com.
About True Green Capital Management
True Green Capital Management LLC («TGC») is a renewable energy investment firm with a solar distributed generation solar portfolio spanning 13 U.S. states. The firm was founded in July 2011 and has a proven track record of having originated, financed, constructed, and operated 500+ MW of distributed solar projects. TGC is focused on investments in the ~$2 trillion distributed power generation market, which is being driven by fundamental changes in generation technologies and economics.
For more information, visit www.truegreencapital.com
![]()
![]() View original content to download multimedia:http://www.prnewswire.com/news-releases/scott-family-housing-expands-solar-rooftop-project-301202250.html
View original content to download multimedia:http://www.prnewswire.com/news-releases/scott-family-housing-expands-solar-rooftop-project-301202250.html
SOURCE Hunt Military Communities


")