BURLINGTON, Mass and PLANO, Texas, Feb. 25, 2021 /PRNewswire-HISPANIC PR WIRE/ — Keurig Dr Pepper Inc. (NASDAQ: KDP) today reported financial results for the fourth quarter and full year ended December 31, 2020 and provided guidance for 2021.
|
|
Reported GAAP Basis
|
Adjusted Basis1
|
|
|
|
|
|
Q4
|
FY 2020
|
Q4
|
FY 2020
|
|
Net Sales
% vs Prior Year
% vs Prior Year – Constant Currency
|
$3.12 bn
6.4%
6.6%
|
$11.62 bn
4.5%
5.0%
|
$3.12 bn
6.4%
6.6%
|
$11.62 bn
4.5%
5.0%
|
|
Diluted EPS
% vs Prior Year
|
$0.30
3.4%
|
$0.93
5.7%
|
$0.39
11.4%
|
$1.40
14.8%
|
Earlier today the Company announced a 25% increase in its annualized dividend rate to $0.75 per share, from the current $0.60 per share, effective with the Company’s regular quarterly dividend to be announced in the second quarter of 2021, subject to official declaration by the Board of Directors. This 25% increase will result in growth of 12.5% in dividends paid in 2021 and another 11.1% increase in 2022, given the calendar timing of both the increase and dividend payments.
Commenting on the announcements, Chairman and CEO Bob Gamgort stated, «KDP again delivered on its annual financial commitments in 2020, capped by a strong fourth quarter with exceptional growth in net sales that was driven by market share gains across our portfolio and accelerated household adoption of the Keurig system. During the year, we implemented robust protocols to keep our employees safe, enhanced our portfolio with innovative new products and strategic partnerships, invested in our supply chain for growth, delivered our corporate responsibility goals and supported our communities. While we expect 2021 to be another challenging and unpredictable year, we’re confident in our ability to deliver the final year of the merger commitments communicated in 2018. We are also confident in our ongoing strong free cash flow generation, which will enable us to return incremental value to our shareholders, while continuing to delever to our targeted level by year-end.»
Full-year 2020 highlights:
- Successfully responded to the COVID-19 pandemic, keeping employees safe, delivering for customers and providing for the communities that KDP serves.
- Delivered strong net sales growth and double-digit Adjusted diluted EPS growth.
- Grew market share2 in more than 90% of the Company’s cold beverage retail base.
- Added approximately three million new U.S. households using the Keurig coffee system.
- Strengthened and expanded KDP’s direct-store-delivery network through multiple transactions, including a long-term agreement with Polar Beverages.
- Reduced financial obligations by more than $1.1 billion, with $240 million of unrestricted cash on hand, and improved KDP’s management leverage ratio by 0.9x to 3.6x at year-end 2020.
- Meaningfully advanced KDP’s sustainability agenda, achieving key 2020 goals.
- Transferred KDP’s stock exchange listing to Nasdaq and entered the Nasdaq-100 Index, supporting KDP’s evolution into a Modern Beverage Company.
2020 Full Year Consolidated Results
Net sales for the full year of 2020 increased 4.5% to $11.62 billion, compared to $11.12 billion in the year-ago period. On a constant currency basis, net sales increased 5.0%, driven by higher volume/mix of 5.6%, partially offset by lower net price realization of 0.6%.
KDP in-market performance remained strong for the year, with dollar market share advancing in more than 90% of KDP’s cold beverage retail base, including CSDs3, premium unflavored still water, teas and fruit drinks, vegetable juice, apple juice and apple sauce. This performance reflected the strength of Dr Pepper, Canada Dry and A&W CSDs, CORE hydration and evian premium water, Snapple tea and juice drinks, Clamato vegetable juice and Motts apple juice and apple sauce. In coffee, retail consumption of single-serve pods manufactured by KDP grew nearly 10% in IRi tracked channels, with accelerated growth in e-commerce, partially offset by significant declines in away from home office and hospitality businesses. In U.S. tracked channels, dollar market share of KDP manufactured pods remained strong at 83%.
GAAP operating income increased 4.3% to $2.48 billion, compared to $2.38 billion in the year-ago period, driven by the strong net sales growth, continued productivity and merger synergies and lower discretionary expenses, primarily marketing. Partially offsetting these factors were the unfavorable year-over-year impact of items affecting comparability, which included $128 million of COVID-19 related costs and a $67 million non-cash impairment charge on the Bai brand. Also unfavorably impacting the comparison were increased operating expenses associated with higher consumer demand, inflation in logistics and certain other COVID-19 related costs. Excluding items affecting comparability, Adjusted operating income increased 10.4% to $3.19 billion, compared to $2.89 billion in the year-ago period, and Adjusted operating margin increased 150 basis points to 27.5%. On a constant currency basis, Adjusted operating income grew 10.8%.
Total COVID-19 related operating costs were $150 million in 2020, including the aforementioned $128 million in costs recognized as items affecting comparability. These costs primarily reflected temporary compensation increases and incentives for front-line employees, as well as incremental health and safety measures across our employee base and enhanced sanitation expenses for our facilities. The remainder of the costs, totaling $22 million, were included in Adjusted results and represented inventory write-downs and bad debt expense in the first half of the year.
GAAP net income for the full year advanced 5.7% to $1.33 billion, or $0.93 per diluted share, compared to $1.25 billion, or $0.88 per diluted share in the year-ago period. This performance was driven by the growth in operating income, lower interest expense, reflecting continued deleveraging that was partially offset by comparison to prior year gains on interest rate swap contracts, and a lower effective tax rate, stemming from favorable valuation adjustments and discrete tax items. These drivers were partially offset by the unfavorable year-over-year impact of items affecting comparability, including the COVID-19 related costs, the non-cash impairment charge on the Bai brand and other non-cash impairment charges on equity investments incurred in 2020. Excluding items affecting comparability, Adjusted net income for the year increased 15% to $1.99 billion, compared to $1.73 billion in the year-ago period, and Adjusted diluted EPS for 2020 increased 15% to $1.40, compared to $1.22 in the year-ago period.
KDP generated exceptionally strong free cash flow of $2.20 billion in 2020, reflecting growth in operating income and ongoing effective working capital management. The free cash flow performance enabled KDP to reduce total financial obligations by $1.12 billion and the Company ended the year with $240 million of unrestricted cash on hand. The Company’s management leverage ratio declined to 3.6x at the end of 2020, compared to 4.5x at the end of 2019, primarily reflecting the reduction in bank debt and strong earnings growth. Since the close of the merger in July 2018, KDP’s management leverage ratio has declined by 2.4x.
|
________________________________________
|
|
1 Adjusted financial metrics used in this release are non-GAAP. See reconciliations of GAAP results to Adjusted results in the accompanying tables.
|
|
2 Market share and retail consumption data based on Keurig Dr Pepper’s custom IRi category definitions for the 13- and 52-week periods ending 12/27/2020.
|
|
3 CSDs refer to «Carbonated Soft Drinks».
|
2020 Full Year Segment Results
Coffee Systems
Net sales in 2020 increased 4.7% to $4.43 billion, compared to $4.23 billion in the year-ago period, reflecting higher volume/mix of 7.2%, partially offset by lower net price realization of 2.4%. Also impacting the net sales performance was unfavorable foreign currency translation of 0.1%. On a constant currency basis, net sales advanced 4.8%.
The volume/mix growth of 7.2% reflected strong pod volume growth of 6.3% and exceptionally strong brewer volume growth of 21%. Pod growth was driven by double-digit at-home consumption, partially offset by a significant decline in the away-from-home business, as work-from-home trends were elevated for most of the year. The strong brewer growth was driven by continued innovation, marketing investments to grow household penetration and a very successful holiday season. For the full year, U.S. households regularly using a Keurig brewer increased approximately 10% to 33 million households.
Operating income increased 4.0% to $1.27 billion in 2020, compared to $1.22 billion in the year-ago period. This performance reflected the growth in net sales, continued productivity and merger synergies and lower discretionary spending, partially offset by unfavorable margin mix related to the exceptionally strong brewer growth and the unfavorable year-over-year impact of items affecting comparability, including $25 million in costs related to COVID-19. Excluding items affecting comparability, Adjusted operating income increased 7.9% to $1.51 billion, compared to $1.40 billion in the year-ago period, and Adjusted operating margin increased 110 basis points to 34.2%. On a constant currency basis, Adjusted operating income grew 8.0%.
Packaged Beverages
Net sales in 2020 increased 8.5% to $5.36 billion, compared to $4.95 billion in the year-ago period, reflecting favorable volume/mix of 8.2% and higher net price realization of 0.3%. This strong performance reflected market share growth across the portfolio, with particular strength in CSDs, premium unflavored water, juice, apple sauce and mixers, partially offset by softness in enhanced flavored water due to a slowdown in the convenience and gas channels for most of the year.
Brands driving the strong net sales performance were Dr Pepper, A&W, Canada Dry, 7UP, Squirt and Sunkist CSDs, Core Hydration and evian premium water, Motts juices, Snapple teas and juice drinks, A Shoc energy, Clamato, Real Lemon and mixers, partially offset by a decline in Bai.
Operating income increased 8.6% to $0.82 billion in 2020, compared to $0.76 billion in the year-ago period, reflecting the strong growth in net sales, lower discretionary expenses, and continued productivity and merger synergies. These growth drivers were partially offset by higher operating costs to meet strong consumer demand, inflation in logistics and the unfavorable year-over-year impact of items affecting comparability, including $101 million in costs related to COVID-19 and a $67 million non-cash impairment charge on the Bai brand. Excluding these and other items affecting comparability, Adjusted operating income increased 30% to $1.02 billion, compared to $0.78 billion in the prior year, and Adjusted operating margin increased 320 basis points to 19.0%. On a constant currency basis, Adjusted operating income grew 31%.
Beverage Concentrates
Net sales in 2020 decreased 6.3% to $1.33 billion, compared to $1.41 billion in the year-ago period, reflecting unfavorable volume/mix of 5.8%, lower net price realization of 0.4% and unfavorable foreign currency translation of 0.1%. This performance primarily reflected the negative impact of COVID-19 on the fountain foodservice business, which primarily serves the restaurant and hospitality channels, due to significantly reduced consumer mobility. On a constant currency basis, net sales decreased 6.2%.
Total shipment volume declined 5.1% versus year-ago due to the aforementioned COVID-19 impact on the fountain foodservice business. Declines in Dr Pepper and Crush were partially offset by increased shipment volume in Squirt. Bottler cases sales volume in 2020 decreased 2.4% versus the prior year.
Operating income in 2020 decreased 2.4% to $932 million, compared to $955 million in the year-ago period, reflecting the lower net sales and the unfavorable year-over-year impact of items affecting comparability, partially offset by lower discretionary expenses. Excluding items affecting comparability, Adjusted operating income decreased 2.0% to $938 million, compared to $957 million in the year-ago period and Adjusted operating margin increased 310 basis points to 70.8%.
Latin America Beverages
Net sales in 2020 decreased 5.9% to $497 million, compared to $528 million in the year-ago period, primarily reflecting the impact of unfavorable foreign currency translation. On a constant currency basis, net sales increased 3.8%, reflecting higher net price realization of 5.8%, partially offset by lower volume/mix of 2.0% due primarily to the impact of COVID-19 in Mexico.
Operating income in 2020 increased 24% to $105 million, compared to $85 million in the year-ago period, reflecting the growth in constant currency net sales, continued productivity and lower discretionary spending, partially offset by the unfavorable impacts of foreign currency transaction expense, inflation in logistics and the unfavorable year-over-year impact of items affecting comparability. Excluding items affecting comparability, Adjusted operating income increased 32% to $108 million, compared to $82 million in the prior year, and Adjusted operating margin increased 620 basis points to 21.7%. On a constant currency basis, Adjusted operating income grew 42.7% versus 2019.
Fourth Quarter Consolidated Results
Net sales in the fourth quarter of 2020 grew at an accelerated rate of 6.4% to $3.12 billion, compared to $2.93 billion in the year-ago period. On a constant currency basis, net sales advanced 6.6%, reflecting higher volume/mix of 6.3% and favorable net price realization of 0.3%.
KDP in-market performance remained strong in the quarter, with dollar market share continuing to advance in more than 90% of KDP’s cold beverage retail base. This performance reflected particular strength in CSDs, premium unflavored water, teas and fruit drinks, vegetable juice, apple juice and apple sauce. In coffee, retail consumption of single-serve pods manufactured by KDP grew more than 7% in IRi tracked channels, with accelerated growth in e-commerce, partially offset by significant declines in away from home office and hospitality businesses. In the U.S. tracked channels, dollar market share of KDP manufactured pods remained strong at 83%.
GAAP operating income decreased 1.8% to $700 million in the fourth quarter of 2020, compared to $713 million in the year-ago period, reflecting the benefits of the strong growth in net sales, lower discretionary expenses, primarily marketing, continued productivity and merger synergies. More than offsetting these factors were the unfavorable comparison to a $30 million gain in the prior year on the sale-leaseback of three manufacturing facilities, higher operating expenses associated with increased consumer demand, inflation in logistics and the unfavorable year-over-year impact of items affecting comparability, including COVID-19 related costs and a $67 million non-cash impairment charge on the Bai brand. Excluding items affecting comparability, Adjusted operating income in the quarter increased 5.5% to $858 million, compared to Adjusted operating income of $813 million in the year-ago period, and Adjusted operating margin declined 20 basis points to 27.5%. On a constant currency basis, Adjusted operating income grew 5.7%.
The COVID-19 related operating costs incurred in the fourth quarter totaled $11 million, all of which were recognized as items affecting comparability, and consisted of temporary compensation increases and incentives for frontline employees, as well as incremental safety and sanitation expenses.
GAAP net income in the fourth quarter of 2020 increased 5.4% to $428 million, or $0.30 per diluted share, compared to GAAP net income of $406 million, or $0.29 per diluted share in the year-ago period. This performance reflected the strong growth in net sales, higher operating income driven by lower discretionary expenses, productivity and merger synergies, as well as lower interest expense and a lower effective tax rate resulting from favorable valuation adjustments and discrete tax items. These drivers were partially offset by the unfavorable year-over-year impact of items affecting comparability, including the aforementioned $67 million non-cash impairment charge on the Bai brand and $11 million of COVID-19 related operating costs. Excluding items affecting comparability, Adjusted net income advanced nearly 13% to $554 million in the fourth quarter of 2020, compared to $491 million in the year-ago period. Adjusted diluted EPS increased 11.4% to $0.39, compared to $0.35 in the year-ago period.
Free cash flow generation remained strong at $685 million in the fourth quarter of 2020, enabling the Company to reduce bank debt by $410 million.
Fourth Quarter Segment Results
Coffee Systems
Net sales for the fourth quarter of 2020 increased 9.1% to $1.32 billion, compared to $1.21 billion in the year-ago period, reflecting higher volume/mix of 10.2%, partially offset by lower net price realization of 1.3%. Also impacting the net sales performance was favorable foreign currency translation of 0.2%. On a constant currency basis, net sales increased 8.9%.
The volume/mix increase of 10.2% in the quarter reflected strong pod volume growth of 7.4% and exceptionally strong brewer growth of nearly 28%. Pod growth was driven by strong at-home consumption, partially offset by continued softness in the away-from-home business, as return to offices and hospitality remain depressed although improved since the second quarter. The strong brewer volume was driven by innovation and increased shipments to retailers during a very successful holiday season.
Operating income increased 17% to $386 million in the fourth quarter of 2020, compared to $329 million in the year-ago period, reflecting the strong growth in net sales, continued productivity and merger synergies and lower discretionary expenses. Partially offsetting these positive drivers were unfavorable margin mix related to the exceptionally strong brewer growth, inflation in logistics and the unfavorable year-over-year impact of items affecting comparability, including $4 million in costs related to COVID-19. Excluding these and other items affecting comparability, Adjusted operating income increased 17% to $431 million, compared to $370 million in the year-ago period, and Adjusted operating margin increased 210 basis points to 32.7%.
Packaged Beverages
Net sales for the fourth quarter of 2020 increased 7.9% to $1.31 billion, compared to $1.21 billion in the year-ago period, reflecting favorable volume/mix of 6.1% due to continued, strong market share expansion across the portfolio and higher net price realization of 1.8%.
Leading the net sales performance were Dr Pepper, A&W, Canada Dry, 7UP, Sunkist and Squirt CSDs, Snapple and Motts juices, CORE hydration and evian premium water and Clamato, partially offset by a decline in Bai.
Operating income in the fourth quarter of 2020 decreased 27% to $165 million, compared to $226 million in the year-ago period, reflecting the unfavorable comparison to a $30 million year-ago gain on the sale-leaseback of three manufacturing facilities, higher operating costs to meet the continued strong consumer demand, inflation in logistics costs, and the unfavorable year-over-year impact of items affecting comparability, which included the $67 million non-cash impairment charge on the Bai brand and $6 million in costs related to COVID-19. Partially offsetting these drivers were the strong growth in net sales, continued productivity and merger synergies and lower discretionary expenses. Excluding items affecting comparability, Adjusted operating income increased 5.6% to $245 million, compared to $232 million in the year-ago period, and Adjusted operating margin declined 50 basis points to 18.7%.
Beverage Concentrates
Net sales for the fourth quarter of 2020 decreased 5.8% to $358 million, compared to $380 million in the year-ago period, reflecting unfavorable volume/mix of 4.5% and lower net price realization of 1.3%. This performance continued to be pressured by COVID-19 as consumer mobility in the restaurant and hospitality channels remained depressed.
Total shipment volume versus year-ago declined 3.4% in the quarter, due to the aforementioned COVID-19 impact on the fountain foodservice business. Declines in Dr Pepper and Crush were partially offset by increased shipment volume in Squirt. Bottler case sales volume decreased 2.1% in the quarter compared to the year-ago period.
Operating income in the fourth quarter of 2020 decreased 4.5% to $253 million, compared to $265 million in the year-ago period, reflecting the impact of the lower net sales, partially offset by lower discretionary expenses and a slight year-over-year benefit from items affecting comparability. Excluding items affecting comparability, Adjusted operating income decreased 4.5% to $254 million, compared to $266 million in the year-ago period, and Adjusted operating margin increased 90 basis points to 70.9%.
Latin America Beverages
Net sales for the fourth quarter of 2020 increased 2.3% to $136 million, compared to net sales of $133 million in the year-ago period, driven by volume/mix growth of 2.3% and higher net price realization of 6.0%, significantly offset by unfavorable foreign currency translation of 6.0%. On a constant currency basis, net sales increased a strong 8.3%.
Operating income in the fourth quarter of 2020 increased 39% to $32 million, compared to $23 million in the year-ago period, reflecting the strong growth in constant currency net sales, continued productivity and lower discretionary expenses, partially offset by the unfavorable impact of foreign currency transaction expense and inflation in logistics. Excluding items affecting comparability, Adjusted operating income increased 32% to $33 million, compared to $25 million in the year-ago period, and Adjusted operating margin increased 550 basis points to 24.3%. On a constant currency basis, Adjusted operating income grew 36% versus the prior year.
KDP Adjusted Guidance for 2021
KDP expects to deliver another year of strong net sales growth in 2021, positioning the Company to exceed its three-year merger target of 2-3% average annual growth. Adjusted diluted EPS is again expected to grow by double-digits, enabling KDP to meet its three-year merger target of 15-17% average annual growth.
Specifically, constant currency net sales growth is expected in the range of 3-4% in 2021, driven by investments in innovation and marketing, the benefits of recent partnerships and ongoing strong in-market execution. Adjusted diluted EPS growth is expected in the range of 13% to 15%, reflecting the benefits of the strong top-line performance and continued merger synergies and productivity, as well as reduced interest expense and improvement in the Company’s effective tax rate.
Supporting this guidance are the following detailed expectations:
- Merger synergies of approximately $200 million, for a three-year total of approximately $600 million, in line with the Company’s merger target.
- Adjusted interest expense in the range of $505 million to $515 million.
- Adjusted effective tax rate in the range of 23.5% to 24.0%.
- Diluted weighted average shares outstanding of approximately 1,430 million.
- Management leverage ratio at or below 3.0x at year end 2021.
Investor Contacts:
Tyson Seely
Keurig Dr Pepper
T: 781-418-3352 / tyson.seely@kdrp.com
Steve Alexander
Keurig Dr Pepper
T: 972-673-6769 / steve.alexander@kdrp.com
Media Contact:
Katie Gilroy
Keurig Dr Pepper
T: 781-418-3345 / katie.gilroy@kdrp.com
About Keurig Dr Pepper
Keurig Dr Pepper (KDP) is a leading beverage company in North America, with annual revenue in excess of $11 billion and nearly 27,000 employees. KDP holds leadership positions in soft drinks, specialty coffee and tea, water, juice and juice drinks and mixers, and markets the #1 single serve coffee brewing system in the U.S. and Canada. The Company’s portfolio of more than 125 owned, licensed and partner brands is designed to satisfy virtually any consumer need, any time, and includes Keurig®, Dr Pepper®, Green Mountain Coffee Roasters®, Canada Dry®, Snapple®, Bai®, Mott’s®, CORE® and The Original Donut Shop®. Through its powerful sales and distribution network, KDP can deliver its portfolio of hot and cold beverages to nearly every point of purchase for consumers. The Company is committed to sourcing, producing and distributing its beverages responsibly through its Drink Well. Do Good. corporate responsibility platform, including efforts around circular packaging, efficient natural resource use and supply chain sustainability. For more information, visit, www.keurigdrpepper.com.
FORWARD LOOKING STATEMENTS
Certain statements contained herein are «forward-looking statements» within the meaning of applicable securities laws and regulations. These forward-looking statements can generally be identified by the use of words such as «outlook,» «guidance,» «anticipate,» «expect,» «believe,» «could,» «estimate,» «feel,» «forecast,» «intend,» «may,» «plan,» «potential,» «project,» «should,» «target,» «will,» «would,» and similar words, phrases or expressions and variations or negatives of these words, although not all forward-looking statements contain these identifying words. Forward-looking statements by their nature address matters that are, to different degrees, uncertain, such as statements regarding the estimated or anticipated future results of the combined company following the combination of Keurig Green Mountain, Inc. («KGM») and Dr Pepper Snapple Group, Inc. («DPS» and such combination, the «transaction»), the anticipated benefits of the transaction, including estimated synergies and cost savings, the long-term merger targets, and other statements that are not historical facts. These statements are based on the current expectations of our management and are not predictions of actual performance.
These forward-looking statements are subject to a number of risks and uncertainties regarding the company’s business and the transaction and actual results may differ materially. These risks and uncertainties include, but are not limited to: (i) the impact the significant additional debt incurred in connection with the transaction may have on our ability to operate our business, (ii) risks relating to the integration of the KGM and DPS operations, products and employees into the combined company and assumption of certain potential liabilities of KGM and the possibility that the anticipated synergies and other benefits of the transaction, including cost savings, will not be realized or will not be realized within the expected timeframe, (iii) the impact of the global COVID-19 pandemic, and (iv) risks relating to the businesses and the industries in which our combined company operates. These risks and uncertainties, as well as other risks and uncertainties, are more fully discussed in the Company’s filings with the SEC, including our Annual Report on Form 10-K and subsequent filings. While the lists of risk factors presented here and in our public filings are considered representative, no such list should be considered to be a complete statement of all potential risks and uncertainties. Any forward-looking statement made herein speaks only as of the date of this document. We are under no obligation to, and expressly disclaim any obligation to, update or alter any forward-looking statements, whether as a result of new information, subsequent events or otherwise, except as required by applicable laws or regulations.
NON-GAAP FINANCIAL MEASURES
This release includes certain non-GAAP financial measures including Adjusted operating income, Adjusted net income, Adjusted diluted EPS and Free Cash Flow, which differ from results using U.S. Generally Accepted Accounting Principles (GAAP). These non-GAAP financial measures should be considered as supplements to the GAAP reported measures, should not be considered replacements for, or superior to, the GAAP measures and may not be comparable to similarly named measures used by other companies. Non-GAAP financial measures typically exclude certain charges, including one-time costs related to the transaction and integration activities, which are not expected to occur routinely in future periods. The Company uses non-GAAP financial measures internally to focus management on performance excluding these special charges to gauge our business operating performance. Management believes this information is helpful to investors because it increases transparency and assists investors in understanding the underlying performance of the Company and in the analysis of ongoing operating trends. Additionally, management believes that non-GAAP financial measures are frequently used by analysts and investors in their evaluation of companies, and continued inclusion provides consistency in financial reporting and enables analysts and investors to perform meaningful comparisons of past, present and future operating results. The most directly comparable GAAP financial measures and reconciliations to non-GAAP financial measures are set forth in the appendix to this release and included in the Company’s filings with the SEC.
To the extent that the Company provides guidance, it does so only on a non-GAAP basis and does not provide reconciliations of such forward-looking non-GAAP measures to GAAP due to the inability to predict the amount and timing of impacts outside of the Company’s control on certain items, such as non-cash gains or losses resulting from mark-to-market adjustments of derivative instruments, among others.
|
KEURIG DR PEPPER INC.
|
|
CONSOLIDATED STATEMENTS OF INCOME
|
|
For the Three Months and Years Ended December 31, 2020 and 2019
|
|
(Unaudited, in millions, except per share data)
|
|
|
For the Three Months Ended
December 31,
|
|
For the Year Ended
December 31,
|
|
|
(in millions, except per share data)
|
2020
|
|
2019
|
|
2020
|
|
2019
|
|
|
Net sales
|
$
|
3,121
|
|
|
$
|
2,934
|
|
|
$
|
11,618
|
|
|
$
|
11,120
|
|
|
Cost of sales
|
1,353
|
|
|
1,241
|
|
|
5,132
|
|
|
4,778
|
|
|
Gross profit
|
1,768
|
|
|
1,693
|
|
|
6,486
|
|
|
6,342
|
|
|
Selling, general and administrative expenses
|
1,000
|
|
|
1,011
|
|
|
3,978
|
|
|
3,962
|
|
|
Impairment of intangible assets
|
67
|
|
|
—
|
|
|
67
|
|
|
—
|
|
|
Other operating (income) expense, net
|
1
|
|
|
(31)
|
|
|
(39)
|
|
|
2
|
|
|
Income from operations
|
700
|
|
|
713
|
|
|
2,480
|
|
|
2,378
|
|
|
Interest expense
|
146
|
|
|
157
|
|
|
604
|
|
|
654
|
|
|
Loss on early extinguishment of debt
|
—
|
|
|
2
|
|
|
4
|
|
|
11
|
|
|
Impairment of investments and note receivable
|
—
|
|
|
—
|
|
|
102
|
|
|
—
|
|
|
Other expense, net
|
(4)
|
|
|
4
|
|
|
17
|
|
|
19
|
|
|
Income before provision for income taxes
|
558
|
|
|
550
|
|
|
1,753
|
|
|
1,694
|
|
|
Provision for income taxes
|
130
|
|
|
144
|
|
|
428
|
|
|
440
|
|
|
Net income
|
$
|
428
|
|
|
$
|
406
|
|
|
$
|
1,325
|
|
|
$
|
1,254
|
|
|
Less: Net income attributable to non-controlling interest
|
—
|
|
|
—
|
|
|
—
|
|
|
—
|
|
|
Net income attributable to KDP
|
$
|
428
|
|
|
$
|
406
|
|
|
$
|
1,325
|
|
|
$
|
1,254
|
|
|
|
|
|
|
|
|
|
|
|
Earnings per common share:
|
|
|
|
|
|
|
|
|
|
Basic
|
$
|
0.30
|
|
|
$
|
0.29
|
|
|
$
|
0.94
|
|
|
$
|
0.89
|
|
|
Diluted
|
0.30
|
|
|
0.29
|
|
|
0.93
|
|
|
0.88
|
|
|
Weighted average common shares outstanding:
|
|
|
|
|
|
|
|
|
|
Basic
|
1,407.3
|
|
|
1,406.9
|
|
|
1,407.2
|
|
|
1,406.7
|
|
|
Diluted
|
1,423.8
|
|
|
1,419.9
|
|
|
1,422.1
|
|
|
1,419.1
|
|
|
KEURIG DR PEPPER INC.
|
|
CONSOLIDATED BALANCE SHEETS
|
|
As of December 31, 2020 and 2019
|
|
(Unaudited, in millions, except shares and per share data)
|
|
|
December 31,
|
|
(in millions, except share and per share data)
|
2020
|
|
2019
|
|
Assets
|
|
Current assets:
|
|
|
|
|
Cash and cash equivalents
|
$
|
240
|
|
|
$
|
75
|
|
|
Restricted cash and restricted cash equivalents
|
15
|
|
|
26
|
|
|
Trade accounts receivable, net
|
1,048
|
|
|
1,115
|
|
|
Inventories
|
762
|
|
|
654
|
|
|
Prepaid expenses and other current assets
|
323
|
|
|
403
|
|
|
Total current assets
|
2,388
|
|
|
2,273
|
|
|
Property, plant and equipment, net
|
2,212
|
|
|
2,028
|
|
|
Investments in unconsolidated affiliates
|
88
|
|
|
151
|
|
|
Goodwill
|
20,184
|
|
|
20,172
|
|
|
Other intangible assets, net
|
23,968
|
|
|
24,117
|
|
|
Other non-current assets
|
894
|
|
|
748
|
|
|
Deferred tax assets
|
45
|
|
|
29
|
|
|
Total assets
|
$
|
49,779
|
|
|
$
|
49,518
|
|
|
Liabilities and Stockholders’ Equity
|
|
Current liabilities:
|
|
|
|
|
Accounts payable
|
$
|
3,740
|
|
|
$
|
3,176
|
|
|
Accrued expenses
|
1,040
|
|
|
939
|
|
|
Structured payables
|
153
|
|
|
321
|
|
|
Short-term borrowings and current portion of long-term obligations
|
2,345
|
|
|
1,593
|
|
|
Other current liabilities
|
416
|
|
|
445
|
|
|
Total current liabilities
|
7,694
|
|
|
6,474
|
|
|
Long-term obligations
|
11,143
|
|
|
12,827
|
|
|
Deferred tax liabilities
|
5,993
|
|
|
6,030
|
|
|
Other non-current liabilities
|
1,119
|
|
|
930
|
|
|
Total liabilities
|
25,949
|
|
|
26,261
|
|
|
Commitments and contingencies
|
|
|
|
|
Stockholders’ equity:
|
|
|
|
|
Preferred stock, $0.01 par value, 15,000,000 shares authorized, no shares issued
|
—
|
|
|
—
|
|
|
Common stock, $0.01 par value, 2,000,000,000 shares authorized, 1,407,260,676 and
1,406,852,305 shares issued and outstanding as of December 31, 2020 and 2019,
respectively
|
14
|
|
|
14
|
|
|
Additional paid-in capital
|
21,677
|
|
|
21,557
|
|
|
Retained earnings
|
2,061
|
|
|
1,582
|
|
|
Accumulated other comprehensive (income) loss
|
77
|
|
|
104
|
|
|
Total stockholders’ equity
|
23,829
|
|
|
23,257
|
|
|
Non-controlling interest
|
1
|
|
|
—
|
|
|
Total equity
|
23,830
|
|
|
23,257
|
|
|
Total liabilities and stockholders’ equity
|
$
|
49,779
|
|
|
$
|
49,518
|
|
|
KEURIG DR PEPPER INC.
|
|
CONSOLIDATED STATEMENTS OF CASH FLOWS
|
|
For The Years Ended December 31, 2020 and 2019
|
|
(Unaudited, in millions)
|
|
|
For the Year Ended December 31,
|
|
(in millions)
|
2020
|
|
2019
|
|
Operating activities:
|
|
|
|
|
Net income
|
$
|
1,325
|
|
|
$
|
1,254
|
|
|
Adjustments to reconcile net income to net cash provided by operating activities:
|
|
|
|
|
Depreciation expense
|
362
|
|
|
358
|
|
|
Amortization of intangibles
|
133
|
|
|
126
|
|
|
Other amortization expense
|
158
|
|
|
174
|
|
|
Provision for sales returns
|
54
|
|
|
43
|
|
|
Deferred income taxes
|
(51)
|
|
|
(23)
|
|
|
Employee stock-based compensation expense
|
85
|
|
|
64
|
|
|
Loss on early extinguishment of debt
|
4
|
|
|
11
|
|
|
(Gain) loss on disposal of property, plant and equipment
|
(36)
|
|
|
(14)
|
|
|
Unrealized (gain) loss on foreign currency
|
(1)
|
|
|
(24)
|
|
|
Unrealized loss on derivatives
|
8
|
|
|
36
|
|
|
Equity in losses of unconsolidated affiliates
|
20
|
|
|
51
|
|
|
Impairment of intangible assets
|
67
|
|
|
—
|
|
|
Impairment on investments and note receivable of unconsolidated affiliates
|
102
|
|
|
—
|
|
|
Other, net
|
60
|
|
|
52
|
|
|
Changes in assets and liabilities:
|
|
|
|
|
Trade accounts receivable
|
(5)
|
|
|
(7)
|
|
|
Inventories
|
(107)
|
|
|
(24)
|
|
|
Income taxes receivable and payables, net
|
(91)
|
|
|
36
|
|
|
Other current and non current assets
|
(435)
|
|
|
(324)
|
|
|
Accounts payable and accrued expenses
|
624
|
|
|
583
|
|
|
Other current and non current liabilities
|
180
|
|
|
102
|
|
|
Net change in operating assets and liabilities
|
166
|
|
|
366
|
|
|
Net cash provided by operating activities
|
2,456
|
|
|
2,474
|
|
|
Investing activities:
|
|
|
|
|
Acquisitions of businesses
|
—
|
|
|
(8)
|
|
|
Issuance of related party note receivable
|
(6)
|
|
|
(32)
|
|
|
Investments in unconsolidated affiliates
|
(5)
|
|
|
(16)
|
|
|
Purchases of property, plant and equipment
|
(461)
|
|
|
(330)
|
|
|
Proceeds from sales of property, plant and equipment
|
203
|
|
|
247
|
|
|
Purchases of intangibles
|
(56)
|
|
|
(35)
|
|
|
Other, net
|
9
|
|
|
24
|
|
|
Net cash used in investing activities
|
(316)
|
|
|
(150)
|
|
|
Financing activities:
|
|
|
|
|
Proceeds from controlling shareholder stock transactions
|
29
|
|
|
—
|
|
|
Proceeds from unsecured credit facility
|
1,850
|
|
|
—
|
|
|
Proceeds from senior unsecured notes
|
1,500
|
|
|
—
|
|
|
Proceeds from term loan
|
—
|
|
|
2,000
|
|
|
Net (repayment) issuance of commercial paper notes
|
(1,246)
|
|
|
167
|
|
|
Proceeds from structured payables
|
171
|
|
|
330
|
|
|
Payments on structured payables
|
(341)
|
|
|
(531)
|
|
|
Payments on senior unsecured notes
|
(250)
|
|
|
(250)
|
|
|
Payment on unsecured credit facility
|
(1,850)
|
|
|
—
|
|
|
Payments on term loan
|
(955)
|
|
|
(3,203)
|
|
|
Payments on finance leases
|
(52)
|
|
|
(38)
|
|
|
Cash dividends paid
|
(846)
|
|
|
(844)
|
|
|
Other, net
|
—
|
|
|
5
|
|
|
Net cash used in financing activities
|
(1,990)
|
|
|
(2,364)
|
|
|
Cash, cash equivalents, restricted cash and restricted cash equivalents — net change from:
|
|
|
|
|
Operating, investing and financing activities
|
150
|
|
|
(40)
|
|
|
Effect of exchange rate changes on cash, cash equivalents, restricted cash and restricted cash equivalents
|
(6)
|
|
|
12
|
|
|
Cash, cash equivalents, restricted cash and restricted cash equivalents at beginning of period
|
111
|
|
|
139
|
|
|
Cash, cash equivalents, restricted cash and restricted cash equivalents at end of period
|
$
|
255
|
|
|
$
|
111
|
|
|
KEURIG DR PEPPER INC.
|
|
RECONCILIATION OF SEGMENT INFORMATION
|
|
(Unaudited)
|
|
|
For the Three Months Ended
December 31,
|
|
For the Year Ended
December 31,
|
|
(in millions)
|
2020
|
|
2019
|
|
2020
|
|
2019
|
|
Net Sales
|
|
|
|
|
|
|
|
|
Coffee Systems
|
$
|
1,320
|
|
|
$
|
1,210
|
|
|
$
|
4,433
|
|
|
$
|
4,233
|
|
|
Packaged Beverages
|
1,307
|
|
|
1,211
|
|
|
5,363
|
|
|
4,945
|
|
|
Beverage Concentrates
|
358
|
|
|
380
|
|
|
1,325
|
|
|
1,414
|
|
|
Latin America Beverages
|
136
|
|
|
133
|
|
|
497
|
|
|
528
|
|
|
Total net sales
|
$
|
3,121
|
|
|
$
|
2,934
|
|
|
$
|
11,618
|
|
|
$
|
11,120
|
|
|
|
|
|
|
|
|
|
|
Income from Operations
|
|
|
|
|
|
|
|
|
Coffee Systems
|
$
|
386
|
|
|
$
|
329
|
|
|
$
|
1,268
|
|
|
$
|
1,219
|
|
|
Packaged Beverages
|
165
|
|
|
226
|
|
|
822
|
|
|
757
|
|
|
Beverage Concentrates
|
253
|
|
|
265
|
|
|
932
|
|
|
955
|
|
|
Latin America Beverages
|
32
|
|
|
23
|
|
|
105
|
|
|
85
|
|
|
Unallocated corporate costs
|
(136)
|
|
|
(130)
|
|
|
(647)
|
|
|
(638)
|
|
|
Total income from operations
|
$
|
700
|
|
|
$
|
713
|
|
|
$
|
2,480
|
|
|
$
|
2,378
|
|
KEURIG DR PEPPER INC.
RECONCILIATION OF CERTAIN NON-GAAP INFORMATION
(Unaudited)
The company reports its financial results in accordance with U.S. GAAP. However, management believes that certain non-GAAP financial measures that reflect the way management evaluates the business may provide investors with additional information regarding the company’s results, trends and ongoing performance on a comparable basis.
For the years ended December 31, 2020 and 2019, we define our Adjusted non-GAAP financial measures as certain financial statement captions and metrics adjusted for certain items affecting comparability. The items affecting comparability are defined below.
Specifically, investors should consider the following with respect to our financial results:
Adjusted: Defined as certain financial statement captions and metrics adjusted for certain items affecting comparability.
Items affecting comparability: Defined as certain items that are excluded for comparison to prior year periods, adjusted for the tax impact as applicable. Tax impact is determined based upon an approximate rate for each item. For each period, management adjusts for (i) the unrealized mark-to-market impact of derivative instruments not designated as hedges in accordance with U.S. GAAP and do not have an offsetting risk reflected within the financial results; (ii) the amortization associated with definite-lived intangible assets; (iii) the amortization of the deferred financing costs associated with the DPS Merger and Keurig Acquisition; (iv) the amortization of the fair value adjustment of the senior unsecured notes obtained as a result of the DPS Merger; (v) stock compensation expense attributable to the matching awards made to employees who made an initial investment in the Keurig Green Mountain, Inc. Executive Ownership Plan, the Keurig Dr Pepper Omnibus Incentive Plan of 2009 or the Keurig Dr Pepper Inc. Omnibus Incentive Plan of 2019; and (vi) other certain items that are excluded for comparison purposes to prior year periods.
For year ended December 31, 2020, the other certain items excluded for comparison purposes include (i) restructuring and integration expenses related to significant business combinations; (ii) productivity expenses; (iii) costs related to significant nonroutine legal matters; (iv) the loss on early extinguishment of debt related to the redemption of debt; (v) incremental temporary costs to our operations related to risks associated with the COVID-19 pandemic; (vi) impairment recognized on equity method investments with Bedford Systems, LLC and LifeFuels Inc; and (vii) impairment recognized on the Bai brand.
Incremental costs to our operations related to risks associated with the COVID-19 pandemic include incremental expenses incurred to either maintain the health and safety of our front-line employees or temporarily increase compensation to such employees to ensure essential operations continue during the pandemic. We believe removing these costs reflects how management views our business results on a consistent basis.
For year ended December 31, 2019, the other certain items excluded for comparison purposes include (i) restructuring and integration expenses related to significant business combinations; (ii) productivity expenses; (iii) transaction costs for significant business combinations (completed or abandoned) excluding the DPS Merger; (iv) costs related to significant nonroutine legal matters; (v) the impact of the step-up of acquired inventory not associated with the DPS Merger (vi) the loss on early extinguishment of debt related to the redemption of debt and (vii) the loss related to the February 2019 organized malware attack on our business operation networks in the Coffee Systems segment.
For the years ended December 31, 2020 and 2019, the supplemental financial data set forth below includes reconciliations of Adjusted income from operations, Adjusted net income and Adjusted diluted EPS to the applicable financial measure presented in the unaudited condensed consolidated financial statement for the same period.
Reconciliations for these items are provided in the tables below.
|
KEURIG DR PEPPER INC.
|
|
RECONCILIATION OF CERTAIN REPORTED ITEMS TO CERTAIN NON-GAAP ADJUSTED ITEMS
|
|
For the Three Months Ended December 31, 2020
|
|
(Unaudited, in millions, except per share data)
|
|
|
Cost of sales
|
|
Gross profit
|
|
Gross margin
|
|
Selling, general and administrative expenses
|
|
Impairment of intangible assets
|
|
Income from operations
|
|
Operating margin
|
|
Reported
|
$
|
1,353
|
|
|
$
|
1,768
|
|
|
56.6
|
%
|
|
$
|
1,000
|
|
|
$
|
67
|
|
|
$
|
700
|
|
|
22.4
|
%
|
|
Items Affecting Comparability:
|
|
|
|
|
|
|
|
|
|
|
|
|
|
|
Mark to market
|
31
|
|
|
(31)
|
|
|
|
|
23
|
|
|
—
|
|
|
(54)
|
|
|
|
|
Amortization of intangibles
|
—
|
|
|
—
|
|
|
|
|
(33)
|
|
|
—
|
|
|
33
|
|
|
|
|
Stock compensation
|
—
|
|
|
—
|
|
|
|
|
(6)
|
|
|
—
|
|
|
6
|
|
|
|
|
Restructuring and integration costs
|
—
|
|
|
—
|
|
|
|
|
(56)
|
|
|
—
|
|
|
56
|
|
|
|
|
Productivity
|
(1)
|
|
|
1
|
|
|
|
|
(24)
|
|
|
—
|
|
|
25
|
|
|
|
|
Impairment of intangible assets
|
—
|
|
|
—
|
|
|
|
|
—
|
|
|
(67)
|
|
|
67
|
|
|
|
|
Nonroutine legal matters
|
—
|
|
|
—
|
|
|
|
|
(14)
|
|
|
—
|
|
|
14
|
|
|
|
|
COVID-19
|
(6)
|
|
|
6
|
|
|
|
|
(5)
|
|
|
—
|
|
|
11
|
|
|
|
|
Adjusted GAAP
|
$
|
1,377
|
|
|
$
|
1,744
|
|
|
55.9
|
%
|
|
$
|
885
|
|
|
$
|
—
|
|
|
$
|
858
|
|
|
27.5
|
%
|
|
Interest expense
|
|
Income before provision for income taxes
|
|
Provision for income taxes
|
|
Effective tax rate
|
|
Net income attributable to KDP
|
|
Weighted Average Diluted shares
|
|
Diluted earnings per share
|
|
Reported
|
$
|
146
|
|
|
$
|
558
|
|
|
$
|
130
|
|
|
23.3
|
%
|
|
$
|
428
|
|
|
1,423.8
|
|
$
|
0.30
|
|
|
Items Affecting Comparability:
|
|
|
|
|
|
|
|
|
|
|
|
|
|
|
Mark to market
|
1
|
|
|
(55)
|
|
|
(14)
|
|
|
|
|
(41)
|
|
|
|
|
(0.03)
|
|
|
Amortization of intangibles
|
—
|
|
|
33
|
|
|
8
|
|
|
|
|
25
|
|
|
|
|
0.02
|
|
|
Amortization of deferred financing costs
|
(3)
|
|
|
3
|
|
|
1
|
|
|
|
|
2
|
|
|
|
|
—
|
|
|
Amortization of fair value debt adjustment
|
(6)
|
|
|
6
|
|
|
2
|
|
|
|
|
4
|
|
|
|
|
—
|
|
|
Stock compensation
|
—
|
|
|
6
|
|
|
1
|
|
|
|
|
5
|
|
|
|
|
—
|
|
|
Restructuring and integration costs
|
—
|
|
|
56
|
|
|
15
|
|
|
|
|
41
|
|
|
|
|
0.03
|
|
|
Productivity
|
—
|
|
|
25
|
|
|
6
|
|
|
|
|
19
|
|
|
|
|
0.01
|
|
|
Impairment of intangible assets
|
—
|
|
|
67
|
|
|
15
|
|
|
|
|
52
|
|
|
|
|
0.04
|
|
|
Nonroutine legal matters
|
—
|
|
|
14
|
|
|
4
|
|
|
|
|
10
|
|
|
|
|
0.01
|
|
|
COVID-19
|
—
|
|
|
11
|
|
|
2
|
|
|
|
|
9
|
|
|
|
|
0.01
|
|
|
Adjusted GAAP
|
$
|
138
|
|
|
$
|
724
|
|
|
$
|
170
|
|
|
23.5
|
%
|
|
$
|
554
|
|
|
1,423.8
|
|
$
|
0.39
|
|
|
|
Diluted earnings per common share may not foot due to rounding.
|
|
KEURIG DR PEPPER INC.
|
|
RECONCILIATION OF CERTAIN REPORTED ITEMS TO CERTAIN NON-GAAP ADJUSTED ITEMS
|
|
For the Three Months Ended December 31, 2019
|
|
(Unaudited, in millions, except per share data)
|
|
|
Cost of sales
|
|
Gross profit
|
|
Gross margin
|
|
Selling, general and administrative expenses
|
|
Other operating expense (income), net
|
|
Income from operations
|
|
Operating margin
|
|
Reported
|
$
|
1,241
|
|
|
$
|
1,693
|
|
|
57.7
|
%
|
|
$
|
1,011
|
|
|
$
|
(31)
|
|
|
$
|
713
|
|
|
24.3
|
%
|
|
Items Affecting Comparability:
|
|
|
|
|
|
|
|
|
|
|
|
|
|
|
Mark to market
|
41
|
|
|
(41)
|
|
|
|
|
5
|
|
|
—
|
|
|
(46)
|
|
|
|
|
Amortization of intangibles
|
—
|
|
|
—
|
|
|
|
|
(32)
|
|
|
—
|
|
|
32
|
|
|
|
|
Stock compensation
|
—
|
|
|
—
|
|
|
|
|
(6)
|
|
|
—
|
|
|
6
|
|
|
|
|
Restructuring and integration costs
|
—
|
|
|
—
|
|
|
|
|
(65)
|
|
|
(1)
|
|
|
66
|
|
|
|
|
Productivity
|
(1)
|
|
|
1
|
|
|
|
|
(19)
|
|
|
—
|
|
|
20
|
|
|
|
|
Transaction costs
|
—
|
|
|
—
|
|
|
|
|
(1)
|
|
|
—
|
|
|
1
|
|
|
|
|
Nonroutine legal matters
|
—
|
|
|
—
|
|
|
|
|
(21)
|
|
|
—
|
|
|
21
|
|
|
|
|
Adjusted GAAP
|
$
|
1,281
|
|
|
$
|
1,653
|
|
|
56.3
|
%
|
|
$
|
872
|
|
|
$
|
(32)
|
|
|
$
|
813
|
|
|
27.7
|
%
|
|
Interest expense
|
|
Income before provision for income taxes
|
|
Provision for income taxes
|
|
Effective tax rate
|
|
Net income attributable to KDP
|
|
Weighted Average Diluted shares
|
|
Diluted earnings per share
|
|
Reported
|
$
|
157
|
|
|
$
|
550
|
|
|
$
|
144
|
|
|
26.2
|
%
|
|
$
|
406
|
|
|
1,419.9
|
|
$
|
0.29
|
|
|
Items Affecting Comparability:
|
|
|
|
|
|
|
|
|
|
|
|
|
|
|
Mark to market
|
(3)
|
|
|
(43)
|
|
|
(12)
|
|
|
|
|
(31)
|
|
|
|
|
(0.02)
|
|
|
Amortization of intangibles
|
—
|
|
|
32
|
|
|
8
|
|
|
|
|
24
|
|
|
|
|
0.02
|
|
|
Amortization of deferred financing costs
|
(3)
|
|
|
3
|
|
|
1
|
|
|
|
|
2
|
|
|
|
|
—
|
|
|
Amortization of fair value debt adjustment
|
(6)
|
|
|
6
|
|
|
1
|
|
|
|
|
5
|
|
|
|
|
—
|
|
|
Stock compensation
|
—
|
|
|
6
|
|
|
2
|
|
|
|
|
4
|
|
|
|
|
—
|
|
|
Restructuring and integration costs
|
1
|
|
|
65
|
|
|
16
|
|
|
|
|
49
|
|
|
|
|
0.04
|
|
|
Productivity
|
—
|
|
|
20
|
|
|
7
|
|
|
|
|
13
|
|
|
|
|
0.01
|
|
|
Transaction costs
|
—
|
|
|
1
|
|
|
1
|
|
|
|
|
—
|
|
|
|
|
—
|
|
|
Loss on early extinguishment of debt
|
—
|
|
|
2
|
|
|
—
|
|
|
|
|
2
|
|
|
|
|
—
|
|
|
Nonroutine legal matters
|
—
|
|
|
21
|
|
|
4
|
|
|
|
|
17
|
|
|
|
|
—
|
|
|
Adjusted GAAP
|
$
|
146
|
|
|
$
|
663
|
|
|
$
|
172
|
|
|
25.9
|
%
|
|
$
|
491
|
|
|
1,419.9
|
|
$
|
0.35
|
|
|
|
Numbers may not foot due to rounding.
|
|
KEURIG DR PEPPER INC.
|
|
RECONCILIATION OF CERTAIN REPORTED ITEMS TO CERTAIN NON-GAAP ADJUSTED ITEMS
|
|
For the Year Ended December 31, 2020
|
|
(Unaudited, in millions, except per share data)
|
|
|
Cost of sales
|
|
Gross profit
|
|
Gross margin
|
|
Selling, general and administrative expenses
|
|
Impairment of intangible assets
|
|
Income from operations
|
|
Operating margin
|
|
Reported
|
$
|
5,132
|
|
|
$
|
6,486
|
|
|
55.8
|
%
|
|
$
|
3,978
|
|
|
$
|
67
|
|
|
$
|
2,480
|
|
|
21.3
|
%
|
|
Items Affecting Comparability:
|
|
|
|
|
|
|
|
|
|
|
|
|
|
|
Mark to market
|
33
|
|
|
(33)
|
|
|
|
|
(5)
|
|
|
—
|
|
|
(28)
|
|
|
|
|
Amortization of intangibles
|
—
|
|
|
—
|
|
|
|
|
(133)
|
|
|
—
|
|
|
133
|
|
|
|
|
Stock compensation
|
—
|
|
|
—
|
|
|
|
|
(27)
|
|
|
—
|
|
|
27
|
|
|
|
|
Restructuring and integration costs
|
—
|
|
|
—
|
|
|
|
|
(199)
|
|
|
—
|
|
|
199
|
|
|
|
|
Productivity
|
(29)
|
|
|
29
|
|
|
|
|
(99)
|
|
|
—
|
|
|
128
|
|
|
|
|
Impairment of intangibles assets
|
—
|
|
|
—
|
|
|
|
|
—
|
|
|
(67)
|
|
|
67
|
|
|
|
|
Nonroutine legal matters
|
—
|
|
|
—
|
|
|
|
|
(57)
|
|
|
—
|
|
|
57
|
|
|
|
|
COVID-19
|
(44)
|
|
|
44
|
|
|
|
|
(84)
|
|
|
—
|
|
|
128
|
|
|
|
|
Adjusted GAAP
|
$
|
5,092
|
|
|
$
|
6,526
|
|
|
56.2
|
%
|
|
$
|
3,374
|
|
|
$
|
—
|
|
|
$
|
3,191
|
|
|
27.5
|
%
|
|
Interest expense
|
|
Loss on early extinguishment of debt
|
|
Impairment on investments and note receivable
|
|
Income before provision for income taxes
|
|
Provision for income taxes
|
|
Effective tax rate
|
|
Net income attributable to KDP
|
|
Weighted Average Diluted shares
|
|
Diluted earnings per share
|
|
Reported
|
$
|
604
|
|
|
$
|
4
|
|
|
$
|
102
|
|
|
$
|
1,753
|
|
|
$
|
428
|
|
|
24.4
|
%
|
|
$
|
1,325
|
|
|
1,422.1
|
|
$
|
0.93
|
|
|
Items Affecting Comparability:
|
|
|
|
|
|
|
|
|
|
|
|
|
|
|
|
|
|
|
Mark to market
|
(27)
|
|
|
—
|
|
|
—
|
|
|
(1)
|
|
|
(1)
|
|
|
|
|
—
|
|
|
|
|
—
|
|
|
Amortization of intangibles
|
—
|
|
|
—
|
|
|
—
|
|
|
133
|
|
|
35
|
|
|
|
|
98
|
|
|
|
|
0.07
|
|
|
Amortization of deferred financing costs
|
(11)
|
|
|
—
|
|
|
—
|
|
|
11
|
|
|
3
|
|
|
|
|
8
|
|
|
|
|
0.01
|
|
|
Amortization of fair value debt adjustment
|
(24)
|
|
|
—
|
|
|
—
|
|
|
24
|
|
|
6
|
|
|
|
|
18
|
|
|
|
|
0.01
|
|
|
Stock compensation
|
—
|
|
|
—
|
|
|
—
|
|
|
27
|
|
|
5
|
|
|
|
|
22
|
|
|
|
|
0.02
|
|
|
Restructuring and integration costs
|
—
|
|
|
—
|
|
|
—
|
|
|
199
|
|
|
49
|
|
|
|
|
150
|
|
|
|
|
0.11
|
|
|
Productivity
|
—
|
|
|
—
|
|
|
—
|
|
|
128
|
|
|
33
|
|
|
|
|
95
|
|
|
|
|
0.07
|
|
|
Impairment of intangibles assets
|
—
|
|
|
—
|
|
|
—
|
|
|
67
|
|
|
15
|
|
|
|
|
52
|
|
|
|
|
0.04
|
|
|
Loss on early extinguishment of debt
|
—
|
|
|
(4)
|
|
|
—
|
|
|
4
|
|
|
1
|
|
|
|
|
3
|
|
|
|
|
—
|
|
|
Impairment on investment
|
—
|
|
|
—
|
|
|
(102)
|
|
|
102
|
|
|
25
|
|
|
|
|
77
|
|
|
|
|
0.05
|
|
|
Nonroutine legal matters
|
—
|
|
|
—
|
|
|
—
|
|
|
57
|
|
|
14
|
|
|
|
|
43
|
|
|
|
|
0.03
|
|
|
COVID-19
|
—
|
|
|
—
|
|
|
—
|
|
|
128
|
|
|
31
|
|
|
|
|
97
|
|
|
|
|
0.07
|
|
|
Adjusted GAAP
|
$
|
542
|
|
|
$
|
—
|
|
|
$
|
—
|
|
|
$
|
2,632
|
|
|
$
|
644
|
|
|
24.5
|
%
|
|
$
|
1,988
|
|
|
1,422.1
|
|
$
|
1.40
|
|
|
|
Diluted earnings per common share may not foot due to rounding.
|
|
KEURIG DR PEPPER INC.
|
|
RECONCILIATION OF CERTAIN REPORTED ITEMS TO CERTAIN NON-GAAP ADJUSTED ITEMS
|
|
For the Year Ended December 31, 2019
|
|
(Unaudited, in millions, except per share data)
|
|
|
Cost of sales
|
|
Gross profit
|
|
Gross margin
|
|
Selling, general and administrative expenses
|
|
Other operating expense (income), net
|
|
Income from operations
|
|
Operating margin
|
|
Reported
|
$
|
4,778
|
|
|
$
|
6,342
|
|
|
57.0
|
%
|
|
$
|
3,962
|
|
|
$
|
2
|
|
|
$
|
2,378
|
|
|
21.4
|
%
|
|
Items Affecting Comparability:
|
|
|
|
|
|
|
|
|
|
|
|
|
|
|
Mark to market
|
35
|
|
|
(35)
|
|
|
|
|
10
|
|
|
—
|
|
|
(45)
|
|
|
|
|
Amortization of intangibles
|
—
|
|
|
—
|
|
|
|
|
(126)
|
|
|
—
|
|
|
126
|
|
|
|
|
Stock compensation
|
—
|
|
|
—
|
|
|
|
|
(24)
|
|
|
—
|
|
|
24
|
|
|
|
|
Restructuring and integration costs
|
(1)
|
|
|
1
|
|
|
|
|
(216)
|
|
|
(25)
|
|
|
242
|
|
|
|
|
Productivity
|
(15)
|
|
|
15
|
|
|
|
|
(60)
|
|
|
(22)
|
|
|
97
|
|
|
|
|
Transaction costs
|
—
|
|
|
—
|
|
|
|
|
(9)
|
|
|
—
|
|
|
9
|
|
|
|
|
Nonroutine legal matters
|
—
|
|
|
—
|
|
|
|
|
(48)
|
|
|
—
|
|
|
48
|
|
|
|
|
Inventory step-up
|
(3)
|
|
|
3
|
|
|
|
|
—
|
|
|
—
|
|
|
3
|
|
|
|
|
Malware incident
|
(2)
|
|
|
2
|
|
|
|
|
(6)
|
|
|
—
|
|
|
8
|
|
|
|
|
Adjusted GAAP
|
$
|
4,792
|
|
|
$
|
6,328
|
|
|
56.9
|
%
|
|
$
|
3,483
|
|
|
$
|
(45)
|
|
|
$
|
2,890
|
|
|
26.0
|
%
|
|
Interest expense
|
|
Loss on early extinguishment of debt
|
|
Income before provision for income taxes
|
|
Provision for income taxes
|
|
Effective tax rate
|
|
Net income attributable to KDP
|
|
Weighted Average Diluted shares
|
|
Diluted earnings per share
|
|
Reported
|
$
|
654
|
|
|
$
|
11
|
|
|
$
|
1,694
|
|
|
$
|
440
|
|
|
26.0
|
%
|
|
$
|
1,254
|
|
|
1,419.1
|
|
$
|
0.88
|
|
|
Items Affecting Comparability:
|
|
|
|
|
|
|
|
|
|
|
|
|
|
|
|
|
Mark to market
|
(47)
|
|
|
—
|
|
|
2
|
|
|
(1)
|
|
|
|
|
3
|
|
|
|
|
—
|
|
|
Amortization of intangibles
|
—
|
|
|
—
|
|
|
126
|
|
|
34
|
|
|
|
|
92
|
|
|
|
|
0.06
|
|
|
Amortization of deferred financing costs
|
(13)
|
|
|
—
|
|
|
13
|
|
|
4
|
|
|
|
|
9
|
|
|
|
|
0.01
|
|
|
Amortization of fair value debt adjustment
|
(26)
|
|
|
—
|
|
|
26
|
|
|
6
|
|
|
|
|
20
|
|
|
|
|
0.01
|
|
|
Stock compensation
|
—
|
|
|
—
|
|
|
24
|
|
|
6
|
|
|
|
|
18
|
|
|
|
|
0.01
|
|
|
Restructuring and integration costs
|
1
|
|
|
—
|
|
|
241
|
|
|
55
|
|
|
|
|
186
|
|
|
|
|
0.13
|
|
|
Productivity
|
—
|
|
|
—
|
|
|
97
|
|
|
24
|
|
|
|
|
73
|
|
|
|
|
0.05
|
|
|
Transaction costs
|
(16)
|
|
|
—
|
|
|
25
|
|
|
7
|
|
|
|
|
18
|
|
|
|
|
0.01
|
|
|
Loss on early extinguishment of debt
|
—
|
|
|
(11)
|
|
|
11
|
|
|
2
|
|
|
|
|
9
|
|
|
|
|
0.01
|
|
|
Nonroutine legal matters
|
—
|
|
|
—
|
|
|
48
|
|
|
11
|
|
|
|
|
37
|
|
|
|
|
0.02
|
|
|
Inventory step-up
|
—
|
|
|
—
|
|
|
3
|
|
|
1
|
|
|
|
|
2
|
|
|
|
|
—
|
|
|
Malware incident
|
—
|
|
|
—
|
|
|
8
|
|
|
2
|
|
|
|
|
6
|
|
|
|
|
—
|
|
|
Adjusted GAAP
|
$
|
553
|
|
|
$
|
—
|
|
|
$
|
2,318
|
|
|
$
|
591
|
|
|
25.5
|
%
|
|
$
|
1,727
|
|
|
1,419.1
|
|
$
|
1.22
|
|
|
|
Diluted earnings per common share may not foot due to rounding.
|
|
KEURIG DR PEPPER INC.
|
|
RECONCILIATION OF SEGMENT ITEMS TO CERTAIN NON-GAAP ADJUSTED SEGMENT ITEMS
|
|
(Unaudited)
|
|
|
(in millions)
|
Reported
|
|
Items Affecting
Comparability
|
|
Adjusted
GAAP
|
|
For the Three Months Ended December 31, 2020
|
|
|
|
|
|
|
Income from Operations
|
|
|
|
|
|
|
Coffee Systems
|
$
|
386
|
|
|
$
|
45
|
|
|
$
|
431
|
|
|
Packaged Beverages
|
165
|
|
|
80
|
|
|
245
|
|
|
Beverage Concentrates
|
253
|
|
|
1
|
|
|
254
|
|
|
Latin America Beverages
|
32
|
|
|
1
|
|
|
33
|
|
|
Unallocated corporate costs
|
(136)
|
|
|
31
|
|
|
(105)
|
|
|
Total income from operations
|
$
|
700
|
|
|
$
|
158
|
|
|
$
|
858
|
|
|
|
|
|
|
|
|
For the Three Months Ended December 31, 2019
|
|
|
|
|
|
|
Income from Operations
|
|
|
|
|
|
|
Coffee Systems
|
$
|
329
|
|
|
$
|
41
|
|
|
$
|
370
|
|
|
Packaged Beverages
|
226
|
|
|
6
|
|
|
232
|
|
|
Beverage Concentrates
|
265
|
|
|
1
|
|
|
266
|
|
|
Latin America Beverages
|
23
|
|
|
2
|
|
|
25
|
|
|
Unallocated corporate costs
|
(130)
|
|
|
50
|
|
|
(80)
|
|
|
Total income from operations
|
$
|
713
|
|
|
$
|
100
|
|
|
$
|
813
|
|
|
|
Numbers may not foot due to rounding.
|
|
KEURIG DR PEPPER INC.
|
|
RECONCILIATION OF SEGMENT ITEMS TO CERTAIN NON-GAAP ADJUSTED SEGMENT ITEMS
|
|
(Unaudited)
|
|
|
(in millions)
|
Reported
|
|
Items Affecting
Comparability
|
|
Adjusted
GAAP
|
|
For the year ended December 31, 2020
|
|
|
|
|
|
|
Income from Operations
|
|
|
|
|
|
|
Coffee Systems
|
$
|
1,268
|
|
|
$
|
246
|
|
|
$
|
1,514
|
|
|
Packaged Beverages
|
822
|
|
|
199
|
|
|
1,021
|
|
|
Beverage Concentrates
|
932
|
|
|
6
|
|
|
938
|
|
|
Latin America Beverages
|
105
|
|
|
3
|
|
|
108
|
|
|
Unallocated corporate costs
|
(647)
|
|
|
257
|
|
|
(390)
|
|
|
Total income from operations
|
$
|
2,480
|
|
|
$
|
711
|
|
|
$
|
3,191
|
|
|
|
|
|
|
|
|
For the year ended December 31, 2019
|
|
|
|
|
|
|
Income from Operations
|
|
|
|
|
|
|
Coffee Systems
|
$
|
1,219
|
|
|
$
|
184
|
|
|
$
|
1,403
|
|
|
Packaged Beverages
|
757
|
|
|
26
|
|
|
783
|
|
|
Beverage Concentrates
|
955
|
|
|
2
|
|
|
957
|
|
|
Latin America Beverages
|
85
|
|
|
(3)
|
|
|
82
|
|
|
Unallocated corporate costs
|
(638)
|
|
|
303
|
|
|
(335)
|
|
|
Total income from operations
|
$
|
2,378
|
|
|
$
|
512
|
|
|
$
|
2,890
|
|
|
KEURIG DR PEPPER INC.
|
|
RECONCILIATION OF ADJUSTED EBITDA AND MANAGEMENT LEVERAGE RATIO
|
|
(Unaudited)
|
|
|
(in millions, except for ratio)
|
|
|
ADJUSTED EBITDA RECONCILIATION – LAST TWELVE MONTHS
|
|
|
Net income
|
$
|
1,325
|
|
|
Interest expense
|
604
|
|
|
Provision for income taxes
|
428
|
|
|
Loss on early extinguishment of debt
|
4
|
|
|
Impairment of investments and note receivable
|
102
|
|
|
Impairment of intangible assets
|
67
|
|
|
Other (income) expense, net
|
17
|
|
|
Depreciation expense
|
362
|
|
|
Other amortization
|
158
|
|
|
Amortization of intangibles
|
133
|
|
|
EBITDA
|
$
|
3,200
|
|
|
Items affecting comparability:
|
|
|
Restructuring and integration expenses
|
$
|
199
|
|
|
Productivity
|
108
|
|
|
Nonroutine legal matters
|
57
|
|
|
Stock compensation
|
27
|
|
|
Mark to market
|
(28)
|
|
|
COVID-19
|
128
|
|
|
Adjusted EBITDA
|
$
|
3,691
|
|
|
|
|
December 31,
|
|
2020
|
|
Principal amounts of:
|
|
|
Commercial paper notes
|
$
|
—
|
|
|
Term loan
|
425
|
|
|
KDP Revolver
|
—
|
|
|
Senior unsecured notes
|
13,225
|
|
|
Total principal amounts
|
13,650
|
|
|
Less: Cash and cash equivalents
|
240
|
|
|
Total principal amounts less cash and cash equivalents
|
$
|
13,410
|
|
|
|
|
December 31, 2020 Management Leverage Ratio
|
3.6
|
|
|
KEURIG DR PEPPER INC.
|
|
RECONCILIATION OF NET CASH PROVIDED BY OPERATING ACTIVITIES TO FREE CASH FLOW
|
|
(Unaudited)
|
|
|
Free cash flow is defined as net cash provided by operating activities adjusted for purchases of property, plant and equipment, proceeds from sales of property, plant and equipment, and certain items excluded for comparison to prior year periods. For the years ended December 31, 2020 and 2019, there were no certain items excluded for comparison to prior year periods.
|
|
|
|
For the Year Ended December 31,
|
|
(in millions)
|
|
2020
|
|
2019
|
|
Net cash provided by operating activities
|
|
$
|
2,456
|
|
|
$
|
2,474
|
|
|
Purchases of property, plant and equipment
|
|
(461)
|
|
|
(330)
|
|
|
Proceeds from sales of property, plant and equipment
|
|
203
|
|
|
247
|
|
|
Free Cash Flow
|
|
$
|
2,198
|
|
|
$
|
2,391
|
|
|
RECONCILIATION OF CERTAIN CURRENCY NEUTRAL ADJUSTED FINANCIAL RESULTS
|
|
(Unaudited)
|
|
|
Net sales, adjusted income from operations and adjusted earnings per share, as adjusted to currency neutral: These adjusted financial results are calculated on a currency neutral basis by converting our current-period local currency financial results using the prior-period foreign currency exchange rates.
|
|
|
|
For the Three Months Ended December 31, 2020
|
|
|
Coffee
|
|
Packaged
|
|
Beverage
|
|
Latin
America
|
|
|
|
Percent change
|
|
Systems
|
|
Beverages
|
|
Concentrates
|
|
Beverages
|
|
Total
|
|
Net sales
|
|
9.1
|
%
|
|
7.9
|
%
|
|
(5.8)
|
%
|
|
2.3
|
%
|
|
6.4
|
%
|
|
Impact of foreign currency
|
|
(0.2)
|
%
|
|
—
|
%
|
|
—
|
%
|
|
6.0
|
%
|
|
0.2
|
%
|
|
Net sales, as adjusted to currency neutral
|
|
8.9
|
%
|
|
7.9
|
%
|
|
(5.8)
|
%
|
|
8.3
|
%
|
|
6.6
|
%
|
|
|
|
For the Three Months Ended December 31, 2020
|
|
|
Coffee
|
|
Packaged
|
|
Beverage
|
|
Latin
America
|
|
|
|
Percent change
|
|
Systems
|
|
Beverages
|
|
Concentrates
|
|
Beverages
|
|
Total
|
|
Adjusted income from operations
|
|
16.5
|
%
|
|
5.6
|
%
|
|
(4.5)
|
%
|
|
32.0
|
%
|
|
5.5
|
%
|
|
Impact of foreign currency
|
|
—
|
%
|
|
—
|
%
|
|
—
|
%
|
|
4.0
|
%
|
|
0.2
|
%
|
|
Adjusted income from operations, as adjusted to
currency neutral
|
|
16.5
|
%
|
|
5.6
|
%
|
|
(4.5)
|
%
|
|
36.0
|
%
|
|
5.7
|
%
|
|
|
|
For the Year Ended December 31, 2020
|
|
|
Coffee
|
|
Packaged
|
|
Beverage
|
|
Latin
America
|
|
|
|
Percent change
|
|
Systems
|
|
Beverages
|
|
Concentrates
|
|
Beverages
|
|
Total
|
|
Net sales
|
|
4.7
|
%
|
|
8.5
|
%
|
|
(6.3)
|
%
|
|
(5.9)
|
%
|
|
4.5
|
%
|
|
Impact of foreign currency
|
|
0.1
|
%
|
|
—
|
%
|
|
0.1
|
%
|
|
9.7
|
%
|
|
0.5
|
%
|
|
Net sales, as adjusted to currency neutral
|
|
4.8
|
%
|
|
8.5
|
%
|
|
(6.2)
|
%
|
|
3.8
|
%
|
|
5.0
|
%
|
|
|
|
For the Year Ended December 31, 2020
|
|
|
Coffee
|
|
Packaged
|
|
Beverage
|
|
Latin
America
|
|
|
|
Percent change
|
|
Systems
|
|
Beverages
|
|
Concentrates
|
|
Beverages
|
|
Total
|
|
Adjusted income from operations
|
|
7.9
|
%
|
|
30.4
|
%
|
|
(2.0)
|
%
|
|
31.7
|
%
|
|
10.4
|
%
|
|
Impact of foreign currency
|
|
0.1
|
%
|
|
0.1
|
%
|
|
—
|
%
|
|
11.0
|
%
|
|
0.4
|
%
|
|
Adjusted income from operations, as adjusted to
currency neutral
|
|
8.0
|
%
|
|
30.5
|
%
|
|
(2.0)
|
%
|
|
42.7
|
%
|
|
10.8
|
%
|
|
|
|
For the Three Months
Ended December 31, 2020
|
|
For the Year Ended
December 31, 2020
|
|
Adjusted diluted earnings per share
|
|
$
|
0.39
|
|
|
$
|
1.40
|
|
|
Impact of foreign currency
|
|
—
|
|
|
—
|
|
|
Adjusted diluted earnings per share, as adjusted to currency neutral
|
|
$
|
0.39
|
|
|
$
|
1.40
|
|
|
The following table sets forth our reconciliation of significant COVID-19-related expenses. However, employee compensation expense and employee protection costs, which impact our SG&A expenses and cost of sales, are included as the COVID-19 item affecting comparability and is excluded in our Adjusted financial measures. In addition, reported amounts under U.S. GAAP also include additional costs, not included as the COVID-19 item affecting comparability, as presented in tables below.
|
|
|
|
|
|
|
|
|
|
|
|
|
Items Affecting Comparability(1)
|
|
|
|
|
|
|
|
(in millions)
|
Employee
Compensation
Expense(2)
|
|
Employee
Protection
Costs(3)
|
|
Allowances for
Expected Credit
Losses(4)
|
|
Inventory Write-
Downs(5)
|
|
Total
|
|
For the Three Months Ended
December 31, 2020
|
|
|
|
|
|
|
|
|
|
|
Coffee Systems
|
$
|
1
|
|
|
$
|
3
|
|
|
$
|
—
|
|
|
$
|
—
|
|
|
$
|
4
|
|
|
Packaged Beverages
|
3
|
|
|
3
|
|
|
—
|
|
|
—
|
|
|
6
|
|
|
Beverage Concentrates
|
—
|
|
|
—
|
|
|
—
|
|
|
—
|
|
|
—
|
|
|
Latin America Beverages
|
—
|
|
|
1
|
|
|
—
|
|
|
—
|
|
|
1
|
|
|
Unallocated corporate costs
|
—
|
|
|
—
|
|
|
—
|
|
|
—
|
|
|
—
|
|
|
Total
|
$
|
4
|
|
|
$
|
7
|
|
|
$
|
—
|
|
|
$
|
—
|
|
|
$
|
11
|
|
|
|
|
|
|
|
|
|
|
|
|
For the year ended December 31,
2020
|
|
|
|
|
|
|
|
|
|
|
Coffee Systems
|
$
|
15
|
|
|
$
|
10
|
|
|
$
|
2
|
|
|
$
|
8
|
|
|
$
|
35
|
|
|
Packaged Beverages
|
76
|
|
|
25
|
|
|
8
|
|
|
—
|
|
|
109
|
|
|
Beverage Concentrates
|
—
|
|
|
—
|
|
|
4
|
|
|
—
|
|
|
4
|
|
|
Latin America Beverages
|
—
|
|
|
2
|
|
|
—
|
|
|
—
|
|
|
2
|
|
|
Unallocated corporate costs
|
—
|
|
|
—
|
|
|
—
|
|
|
—
|
|
|
—
|
|
|
Total
|
$
|
91
|
|
|
$
|
37
|
|
|
$
|
14
|
|
|
$
|
8
|
|
|
$
|
150
|
|
|
|
|
|
|
|
|
|
|
|
|
|
|
(1)
|
Employee compensation expense and employee protection costs are both included as the COVID-19 items affecting comparability in the reconciliation of our Adjusted Non-GAAP financial measures.
|
|
(2)
|
Primarily reflects temporary incremental frontline incentive pay and the associated taxes in order to maintain essential operations during the COVID-19 pandemic. Impacts both cost of sales and SG&A expenses. In mid-September 2020, we discontinued the incremental frontline incentive pay program.
|
|
(3)
|
Includes costs associated with personal protective equipment, temperature scans, cleaning and other sanitization services. Impacts both cost of sales and SG&A expenses.
|
|
(4)
|
Allowances reflect the expected impact of the economic uncertainty caused by COVID-19, leveraging estimates of credit worthiness, default and recovery rates for certain of our customers. Impacts SG&A expenses.
|
|
(5)
|
Inventory write-downs represent obsolescence charges, which impact cost of sales.
|

Logo – https://mma.prnewswire.com/media/724482/Keurig_Dr_Pepper_logo.jpg
SOURCE Keurig Dr Pepper


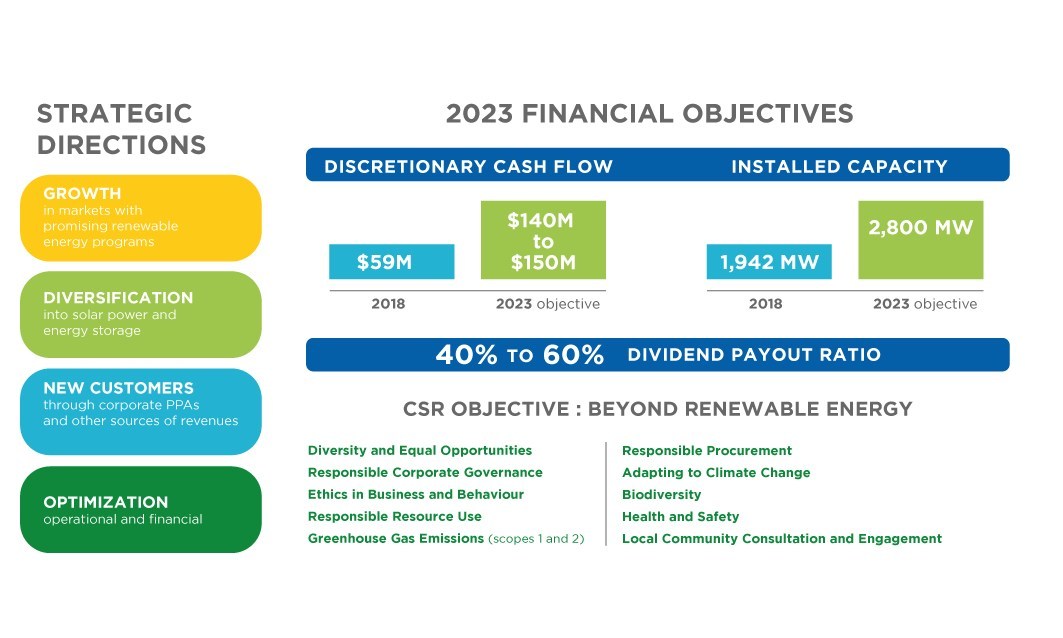
")
 The Evits et Josaphat repowering project represents a total capacity of 14 MW with an increase of 2 MW while the Remise de Reclainville repowering project represents a total capacity of 14 MW with an increase of 2 MW, and the Mont de Bézard 2 repowering project represents a total capacity of 25 MW with an increase of 13 MW. - (2) The project represents a total capacity of 200 MW. The Corporation is currently considering whether the project should be consolidated in its financial statements. - (3) The total project investment and the estimated annual EBITDA for projects in France have been translated into Canadian dollars at the closing rate on December 31, 2020. (CNW Group/Boralex Inc.)")


")