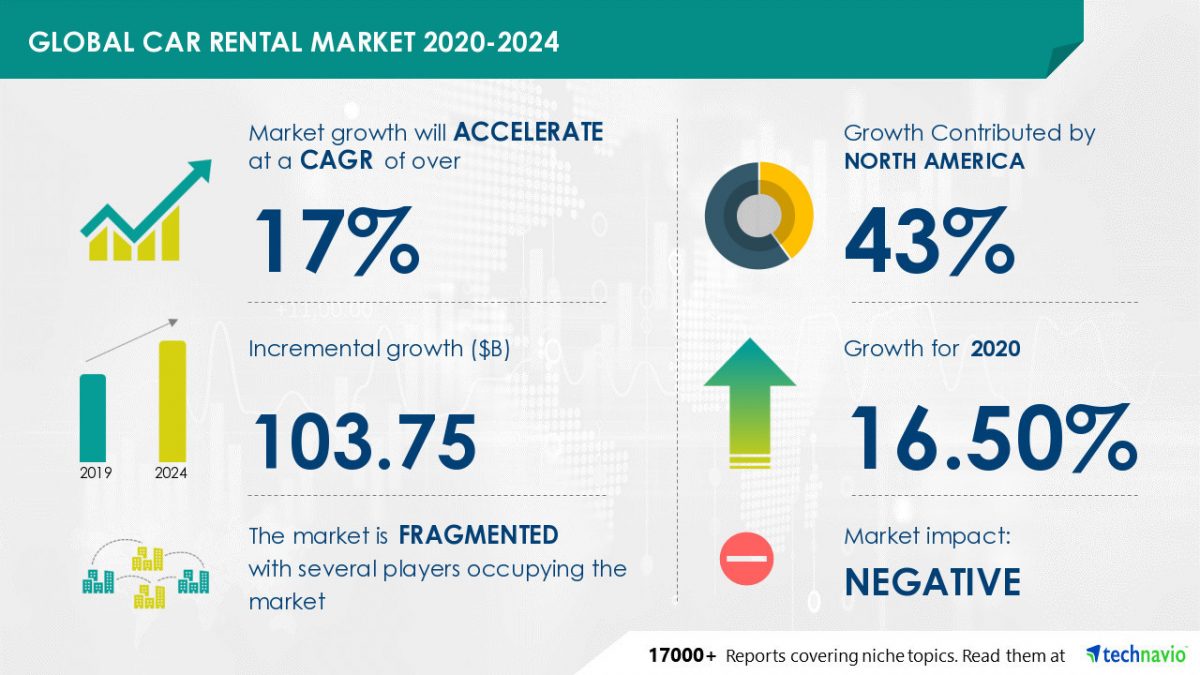
NEW YORK, March 8, 2021 /PRNewswire/ — The global car rental market is poised to grow by USD 103.75 billion during 2020-2024, progressing at a CAGR of over 17% during the forecast period. The report offers an up-to-date analysis regarding the current market scenario, latest trends and drivers, and the overall market environment.
For more details, Get a Free Sample Report Delivered Instantly
Impact of COVID-19
The COVID-19 pandemic continues to transform the growth of various industries, however, the immediate impact of the outbreak is varied. While a few industries will register a drop in demand, numerous others will continue to remain unscathed and show promising growth opportunities. COVID-19 will have a low impact on the car rental market.
Frequently Asked Questions:
- Based on segmentation by Type, which is the leading segment in the market?
Based on the type, the market saw maximum growth in the economy cars segment in 2019.
- What are the major trends in the market?
Advances in rental processes will be the major trend in the market.
- At what rate is the market projected to grow?
The market is projected to grow at a CAGR of over 17% during the forecast period.
- Who are the top players in the market?
Avis Budget Group Inc., Carzonrent India Pvt. Ltd., Enterprise Holdings Inc., Europcar Mobility Group SA, Expedia Group Inc., Hertz Global Holdings Inc., Localiza Rent a Car SA, Movida Participações SA, SIXT SE, and Turo Inc. are the major players in the market.
- What are the key market drivers and challenges?
The market is driven by the incorporation of advanced digital technologies. However, security issues of telematics in vehicles might challenge growth.
- How big is the North American market?
North America dominated the market with a 43% share in 2019.
Related Reports on Financials Include:
Railcar Leasing Market in Europe – Railcar leasing market in Europe is segmented by type (freight cars, tank wagons, and intermodals) and geography (Germany, France, the UK, Poland, and the Rest of Europe). Get an Exclusive Free Sample Report
Global Automotive Usage-based Insurance Market – Global automotive usage-based insurance market is segmented by geography (APAC, Europe, and North America), pricing scheme (pay-how-you-drive, pay-as-you-drive, and manage-how-you-drive), and application (automotive embedded UBI and automotive app-based UBI). Get an Exclusive Free Sample Report
Develop Smart Strategies for Your Business: Grab a Free Sample Report Now!
The market is fragmented, and the degree of fragmentation will accelerate during the forecast period. Avis Budget Group Inc., Carzonrent India Pvt. Ltd., Enterprise Holdings Inc., Europcar Mobility Group SA, Expedia Group Inc., Hertz Global Holdings Inc., Localiza Rent a Car SA, Movida Participações SA, SIXT SE, and Turo Inc. are some of the major market participants. Although the incorporation of advanced digital technologies will offer immense growth opportunities, security issues of telematics in vehicles are likely to pose a challenge for the market vendors. In a bid to help players strengthen their market foothold, this car rental market forecast report provides a detailed analysis of the leading market vendors. The report also empowers industry honchos with information on the competitive landscape and insights into the different product offerings offered by various companies.
Technavio’s custom research reports offer detailed insights on the impact of COVID-19 at an industry level, a regional level, and subsequent supply chain operations. This customized report will also help clients keep up with new product launches in direct & indirect COVID-19 related markets, upcoming vaccines and pipeline analysis, and significant developments in vendor operations and government regulations.
Car Rental Market 2020-2024: Segmentation
Car Rental Market is segmented as below:
- Type
- Economy Cars
- Executive Cars
- Luxury Cars
- SUVs
- MUVs
- Geographic Landscape
- APAC
- Europe
- MEA
- North America
- South America
- Mode of Booking
- Rental Category
- Airport Transport
- Local Transport
- Outstation Transport
- Other Transport
To learn more about the global trends impacting the future of market research, download a free sample: https://www.technavio.com/talk-to-us?report=IRTNTR40065
Car Rental Market 2020-2024: Scope
Technavio presents a detailed picture of the market by the way of study, synthesis, and summation of data from multiple sources. The car rental market report covers the following areas:
- Car Rental Market Size
- Car Rental Market Trends
- Car Rental Market Industry Analysis
This study identifies advances in rental processes as one of the prime reasons driving the Car Rental Market growth during the next few years.
Technavio suggests three forecast scenarios (optimistic, probable, and pessimistic) considering the impact of COVID-19. Technavio’s in-depth research has direct and indirect COVID-19 impacted market research reports.
Register for a free trial today and gain instant access to 17,000+ market research reports.
Technavio’s SUBSCRIPTION platform
Car Rental Market 2020-2024: Key Highlights
- CAGR of the market during the forecast period 2020-2024
- Detailed information on factors that will assist car rental market growth during the next five years
- Estimation of the car rental market size and its contribution to the parent market
- Predictions on upcoming trends and changes in consumer behavior
- The growth of the car rental market across APAC, Europe, MEA, North America, and South America
- Analysis of the market’s competitive landscape and detailed information on vendors
- Comprehensive details of factors that will challenge the growth of car rental market vendors
Table of Contents:
PART 01: EXECUTIVE SUMMARY
PART 02: SCOPE OF THE REPORT
- 2.1 Preface
- 2.2 Currency conversion rates for US$
PART 03: MARKET LANDSCAPE
- Market ecosystem
- Market characteristics
- Market segmentation analysis
PART 04: MARKET SIZING
- Market definition
- Market sizing 2019
- Market size and forecast 2019-2024
PART 05: FIVE FORCES ANALYSIS
- Bargaining power of buyers
- Bargaining power of suppliers
- Threat of new entrants
- Threat of substitutes
- Threat of rivalry
- Market condition
PART 06: MARKET SEGMENTATION BY TYPE
- Market segmentation by type
- Comparison by type
- Economy cars – Market size and forecast 2019-2024
- Executive cars – Market size and forecast 2019-2024
- Luxury cars – Market size and forecast 2019-2024
- SUVs – Market size and forecast 2019-2024
- MUVs – Market size and forecast 2019-2024
- Market opportunity by type
PART 07: CUSTOMER LANDSCAPE
PART 08: GEOGRAPHIC LANDSCAPE
- Geographic segmentation
- Geographic comparison
- North America – Market size and forecast 2019-2024
- Europe – Market size and forecast 2019-2024
- APAC – Market size and forecast 2019-2024
- South America – Market size and forecast 2019-2024
- MEA – Market size and forecast 2019-2024
- Key leading countries
- Market opportunity
PART 09: MARKET SEGMENTATION BY MODE OF BOOKING
- Market segmentation by mode of booking
- Comparison by mode of booking
- Offline – Market size and forecast 2019-2024
- Online – Market size and forecast 2019-2024
- Market opportunity by mode of booking
PART 10: MARKET SEGMENTATION BY RENTAL CATEGORY
- Market segmentation by rental category
- Comparison by rental category
- Airport transport – Market size and forecast 2019-2024
- Local transport – Market size and forecast 2019-2024
- Outstation transport – Market size and forecast 2019-2024
- Other transport – Market size and forecast 2019-2024
- Market opportunity by rental category
PART 11: DECISION FRAMEWORK
PART 12: DRIVERS AND CHALLENGES
- Market drivers
- Market challenges
PART 13: MARKET TRENDS
- Advent of intermediaries
- Value-for-money car rental services
- Advances in rental processes
- Growing interest in self-driving vehicles
PART 14: VENDOR LANDSCAPE
- Overview
- Landscape disruption
- Competitive scenario
PART 15: VENDOR ANALYSIS
- Vendors covered
- Vendor classification
- Market positioning of vendors
- Avis Budget Group Inc.
- Carzonrent India Pvt. Ltd.
- Enterprise Holdings Inc.
- Europcar Mobility Group SA
- Expedia Group Inc.
- Hertz Global Holdings, Inc.
- Localiza Rent a Car SA
- Movida Participações SA
- SIXT SE
- Turo Inc.
PART 16: APPENDIX
- Research methodology
- List of abbreviations
- Definition of market positioning of vendors
PART 17: EXPLORE TECHNAVIO
About Us
Technavio is a leading global technology research and advisory company. Their research and analysis focuses on emerging market trends and provides actionable insights to help businesses identify market opportunities and develop effective strategies to optimize their market positions. With over 500 specialized analysts, Technavio’s report library consists of more than 17,000 reports and counting, covering 800 technologies, spanning across 50 countries. Their client base consists of enterprises of all sizes, including more than 100 Fortune 500 companies. This growing client base relies on Technavio’s comprehensive coverage, extensive research, and actionable market insights to identify opportunities in existing and potential markets and assess their competitive positions within changing market scenarios.
Contact
Technavio Research
Jesse Maida
Media & Marketing Executive
US: +1 844 364 1100
UK: +44 203 893 3200
Email: media@technavio.com
Website: www.technavio.com/
Report Link: https://www.technavio.com/report/car-rental-market-industry-analysis
 View original content to download multimedia:http://www.prnewswire.com/news-releases/-103-75-billion-growth-in-car-rental-market-2020-2024–advances-in-rental-processes-to-emerge-as-key-trend–technavio-301241940.html
SOURCE Technavio