Costa Rica’s Top 5 Expat Havens in 2021–InternationalLiving.com

BALTIMORE, Jan. 26, 2021 /PRNewswire-PRWeb/ — Costa Rica tops International Living’s Annual Global Retirement Index this year for good reason. Close to the States, it offers great weather, beautiful beaches, and world-class healthcare. It doesn’t hurt that many retired couples report they live well on $2,000 a month—that includes all their costs.

Established and welcoming expat communities exist all across the country, which makes fitting in relatively easy….

BALTIMORE, Jan. 26, 2021 /PRNewswire-PRWeb/ — Costa Rica tops International Living’s Annual Global Retirement Index this year for good reason. Close to the States, it offers great weather, beautiful beaches, and world-class healthcare. It doesn’t hurt that many retired couples report they live well on $2,000 a month—that includes all their costs.

Established and welcoming expat communities exist all across the country, which makes fitting in relatively easy. While it’s helpful to speak Spanish, expats report that in many spots it’s possible to get by largely in English.

«Costa Rica ticks a lot of boxes for the prospective expat who, worried about retirement in the States, is looking for lower-cost, higher-quality options abroad,» says Jennifer Stevens, Executive Editor, International Living. «In Costa Rica, you’ve got a real variety of lifestyles you can choose from, all on a modest budget. From Pacific coast beach towns to cooler highland escapes—this country has a lot to offer American and Canadian retirees.

«Prospective expats seem to be taking notice. At our International Living website, we’ve seen a 178% increase in traffic to our Costa Rica content over the last month.»

Transplants from North America and farther afield live all over Costa Rica today, but International Living has identified the top five havens there for expats and retirees:

1. Central Valley

It’s hard to beat the Central Valley for beauty, friendliness, and good-value living. Nestled among forests, mountains, and farms are villages where expats have been living side-by-side with Costa Ricans for many decades.

Like the name would suggest, the Central Valley is central. San José, the country’s capital, and its suburbs are within an hour-and-a-half at most from just about anywhere in the Valley. That’s where expats go to find the best shopping in the country, including North American-style malls and warehouse shopping clubs.

«A lot of expats choose to live in one of San Jose’s suburbs, such as Santa Ana or Escazú,» says Kathleen Evans, IL Costa Rica Correspondent. «This way, they can enjoy suburban living close to the city and its amenities, but also enjoy life a little bit outside the city with its spectacular mountain views.»

The Central Valley is dotted with communities where expats have settled. Throughout the Valley there are historic towns that attract retirees seeking to upgrade their lifestyle while the trim their budget. Popular towns are Atenas, Grecia, Cartago, and San Ramon.

«The Central Valley is also where our main international airport is,» says Evans.

«So, if you do like to travel around and explore new things, you are right in the middle of the action. They’re the reasons why about 70% of the population of the country choose to live in the Central Valley.»

2. Arenal

Home to both Costa Rica’s largest volcano, Volcán Arenal, and its largest freshwater lake, this area is perfect for anybody after a laidback retirement in a rural setting, surrounded by natural beauty. The area, nestled between the provinces of Alajuela and Guanacaste, is suited for lovers of the great outdoors or those looking for a small-town vibe.

«You’re not going to find large scale development like you will in some of the other communities around the country,» says Evans. «The expats who live there, enjoy that area because they’re completely one with nature.»

The most popular expat town on the lake is called Nuevo Arenal. This is where people go for the staples of daily life: pharmacy, medical clinic, bank, gas station, grocery stores, restaurants…perfect for everyday shopping and errands. Expats can also be found on the opposite shore, in towns like La Fortuna, which is closer to the volcano.

Thanks to the lake and surrounding mountains, residents enjoy hiking, natural hot springs, mountain biking, rock climbing, whitewater rafting, world-class windsurfing, and paddle boarding.

«The lake area is about an equal distance from both of the main airports,» says Kathleen. «So, it’s nice to have that choice if you want to fly in one and out the other. And as far as the weather, it’s absolutely beautiful. You’ll have no need for heat or air conditioning here.»

3. The Gold Coast

Many expats looking for a warm climate, a healthy lifestyle, and proximity to the beach that won’t cost a fortune have chosen Costa Rica’s Gold Coast in the north.

Home to more than 65 of Costa Rica’s nearly 300 beaches—some remote and some the centerpiece of buzzing beach communities—Guanacaste draws expats and international tourists from all corners of the world. Not only do the beaches check the boxes of beautiful, safe, and clean, but they each offer something of a different character.

Among the most popular beach communities for expats in the area are Playa del Coco, Playa Hermosa, Conchal, Tamarindo, and Nosara. These communities offer conveniences for daily living, business opportunities and infrastructure, and a natural hub for fun things to do. The coast is also dotted with plenty of up-and-coming towns as well.

«Every beach has its own personality,» says Evans. «If you like a touristy town with lots of restaurants and different food choices and things to do, you might want to look at places like Playa del Coco and Tamarindo. But there are also lots of little sweet, quiet communities, and the only way to discover them is to get in your car and drive along the coast.»

The cost of living is variable in Guanacaste depending on your lifestyle. Most expats in the region say they can live well on around $2,000 per month. Many find ways to live for less, and likewise, some spend much more.

4. Central Pacific Coast

The Central Pacific Coast stretches from Puntarenas to Manuel Antonio. The most popular expat places here would be Playa Herradura, where there is a large upscale development called Los Sueños, Playa Jaco, Esterillos, and down the coast to Quepos and Manuel Antonio.

«The Central Pacific coast is the most established in the country,» says Evans.

«These are the beaches that are closest to the capital in San Jose—within an hour or two—which means easy access to healthcare, shopping, and an international airport.»

The Central Coast is a little more topical and more lush than dryer Guanacaste to the north. On this Central Coast, there’s a bit more of a rainy season, but the tradeoff is that everything is greener.

Manuel Antonio is the site of the country’s most popular national park. At 4,000 acres, it’s a relatively small refuge and one of the smallest national parks. But the rainforest is home to capuchin monkeys, three-toed sloths, coatis, and much more. Within the park boundaries, sit some of Costa Rica’s most beautiful beaches. There are four protected coves where white sand meets clear blue water, with jungle-clad hills rising dramatically from the shoreline.

«The Central Pacific Coast is also home to the country’s largest LGBTQ+ community. So, if you’re looking for an alternative lifestyle, it is very gay-friendly there,» says Evans.

5. The Southern Zone

About three to four hours from San José and the Central Valley, the Southern Zone offers a totally different landscape, lifestyle, and climate. It’s an unspoiled seaside wilderness with a laidback beach lifestyle and a warm, coastal climate.

The Southern Zone stretches all the way to Panama, but most expats are concentrated in and around three main towns—Playa Dominical, Playa Uvita, and Ojochal.

Dominical, a small surf village, is the gateway to the region. Uvita is the commercial hub, with banks, hardware stores, and pharmacies. Ojochal is the jungle village famed for its gourmet restaurants, which are run by an international cast of expat foodies. Expats here relish the mix of natural beauty and off-the-beaten-path life, yet with modern conveniences at hand.

Completion of the coastal highway in 2010 significantly cut drive time to the Southern Zone and opened up this area to expats, but development is small-scale, and the region is still unspoiled.

Evans says, «the real estate there tends to be a little bit less expensive than some of the other larger beach communities to the north because it is a little bit less developed.»

The full report on Costa Rica’s top five expat havens—including a video from our IL Costa Rica Correspondent and a closer look at the Caribbean side of Costa Rica—can be found here: Best Places to Live in Costa Rica: Five Top Expat Havens.

International Living’s complete 2021 Annual Global Retirement Index, including more information on Costa Rica and the other nine countries that made it in to the top 10—as well as the individual rankings in all 10 categories for all 25 countries included—can be found at: The World’s Best Places to Retire in 2021.

Members of the media have permission to republish the article linked above once credit is given to Internationalliving.com.

Further information, as well as interviews with expert authors for radio, TV or print, is available on request. Photos are also available.

For information about InternationalLiving.com content republishing, source material or to book an interview with one of our experts, contact Editorial Director for Web Content, Social Media, and PR, Donal Lucey, dlucey@internationalliving.com.

Instagram: https://www.instagram.com/internationalliving/
Twitter: @inliving
Facebook: https://www.facebook.com/International.Living/

About International Living

Since 1979, InternationalLiving.com has been the leading authority for anyone looking for global retirement or relocation opportunities. Through its monthly magazine and related e-letters, extensive website, podcasts, online bookstore, and events held around the world, InternationalLiving.com provides information and services to help its readers live better, travel farther, have more fun, save more money, and find better business opportunities when they expand their world beyond their own shores. InternationalLiving.com has contributors traveling the globe, investigating the best opportunities for travel, retirement, real estate, and investment.

Media Contact

Donal Lucey, www.internationalliving.com, +001 667 312 3532, DLucey@internationalliving.com

Twitter


SOURCE InternationalLiving.com

Sigo Partners with Mexico-based Saive to Launch First Spanish-Language Safe Driving App in the U.S.

HARRISON, N.J., Jan. 26, 2021 /PRNewswire-PRWeb/ — Sigo, an inclusive auto insurance provider focused on providing affordable access to underserved populations, has partnered with Mexico-based <a target="_blank"…

HARRISON, N.J., Jan. 26, 2021 /PRNewswire-PRWeb/ — Sigo, an inclusive auto insurance provider focused on providing affordable access to underserved populations, has partnered with Mexico-based Saive to launch the Calles Seguras Initiative through the Sigo powered by Saive App, a free safe driving app now available to all drivers. Use of the mobile telematics solution, the first in the U.S. that’s natively in Spanish, allows users to review their driving behavior, become a safer driver, and earn rewards while doing so.

According to Pew Research, Hispanics have accounted for more than half of the U.S. population growth since 2010. To better serve this segment of the population, and the growing number of Hispanic drivers, Sigo created a bi-lingual, tech-enabled solution to help customers with limited insurance histories get basic liability policies without having to visit a brick-and-mortar agency or pay extra fees. With the introduction of the Calles Seguras Initiative, the Hispanic population can now also continue to improve their driving skills, whether they are a Sigo customer or not.

«In order to address the underlying discrimination within auto insurance pricing, we need to overhaul the way rates are calculated. Telematics already has and will continue to be a critical piece of the puzzle in building a fairer pricing model,» said Nestor Hugo Solari, Co-Founder and CEO of Sigo. «Our partnership with Saive to bring a Spanish-language safe driving app to the U.S. will not only make our roads safer but will also soon help customers save money on their insurance, regardless of factors like zip code, education or credit score.»

Saive has already been helping drivers in Mexico with their Driver Score algorithm and Driver Assistant, technology that has been implemented into this new app. Once enabled in one’s vehicle, the app tracks factors such as acceleration, hard braking, speed, sharp turning, distance driven, and late-night driving. The app will also capture miles driven without texting and minutes without looking at one’s phone. «The data collected provides significant value not just for insurers, but for drivers to improve their habits to make our roads safer,» said Salvador Rochin, Co-Founder and Chief Product Officer of SAIVE

Upon completing a trip, the Driver Assistant will alert users to any distracted driving habits as well as share tips for safer driving. After at least 100 miles have been driven, drivers who follow the speed limit, don’t text and drive, and avoid sharp braking and turning, among other safe habits, can begin earning rewards like Amazon gift cards.

«More than 38,000 people in the U.S. lose their lives each year in car crashes. Saive’s goal has always been to reduce the number of road accidents and protect all drivers, so we’re excited to continue furthering our impact in the U.S. with the help of Sigo,» said Moisés Maislin, Co-Founder and CEO of Saive.

Currently, the Sigo powered by Saive app is available to all drivers and can be downloaded on the Apple App Store and Google Play Store free of charge. Sigo customers in California and Texas who use the usage-based mileage app will have access to insurance cost-saving in 2021. Customers will receive discounts first for opting-in to the program as well as added discounts based on their safe driving habits.

For more information about the Calles Seguras Initiative and the Sigo powered by Saive app, visit https://sigoinsurance.com/saive.

About Sigo
Sigo is an inclusive auto insurance provider focused on the $20 billion emerging non-standard auto insurance market. Sigo provides affordable access via its direct-to-consumer platform that is tech-enabled, bilingual, and mobile-first. By helping customers with limited insurance histories get basic auto insurance, Sigo is better serving the segment of «non-standard» drivers by providing transparent and reliable coverage. Sigo is currently available in California and Texas and was co-founded in 2019 by Néstor Hugo Solari and Júlio Erdos. For more information, visit https://sigoinsurance.com/.

About Saive
Saive utilizes smartphone technology that process driving behavior data to insurers, OEMs and more, to design easy and affordable mobile usage-based insurance products (PAYD, PHYD and Hybrid models) for the Hispanic markets in the Americas Region. Saive have been accelerated by Google Advantage Program (2018) and Puente Labs in Silicon Valley (2019). Its Vision for 2025 is to predict car accidents in real time to save lives by using the most adoptable technology in the world: smartphones. Being the first telematic company offering «cash-back» models, SAIVE has been strengthening its presence in the Latin American market since the pandemic started in 2020. For more information, visit https://saive.app/.

Media Contact

Nestor Solari, Sigo, +1 (877)476-7446 Ext: 1, nestor@sigoseguros.com

Facebook


SOURCE Sigo

Omni Oklahoma City Hotel Proudly Opens Its Doors To The Oklahoma City Community

OKLAHOMA CITY, Jan. 26, 2021 /PRNewswire/ — Today, Omni Hotels & Resorts celebrates the grand opening of the highly anticipated <a target="_blank"…

OKLAHOMA CITY, Jan. 26, 2021 /PRNewswire/ — Today, Omni Hotels & Resorts celebrates the grand opening of the highly anticipated Omni Oklahoma City Hotel, a 605-guest room convention center hotel in the heart of Oklahoma City.

Images and videos of the hotel and ceremonious ribbon cutting can be found HERE.

Executives from Omni held a ribbon cutting alongside Oklahoma City Convention and Visitors Bureau Interim Director Mike Burns, The Honorable Oklahoma City Mayor David Holt, The Honorable Lt. Gov. Matt Pinnell, The Alliance for Economic Development of Oklahoma City President and CEO Cathy O’Connor and Greater Oklahoma City Chamber President and CEO Roy Williams. The 17-story hotel located at 100 West Oklahoma City Blvd. will serve the city’s revitalized downtown area including the convention center, Scissortail Park and Chesapeake Energy Arena, home of the NBA’s Oklahoma City Thunder.

«Those who walk through our doors, whether you’re traveling to Oklahoma City or you are a local enjoying a staycation or a day downtown, will feel an immediate sense of the deep authenticity and rich culture that this city has to offer,» Omni Oklahoma City General Manager Steve Keenan said. «Omni will offer a new and elegant way to experience an Oklahoma City adventure as we continuously aim to go the extra mile with every interaction and every gesture.»

Omni Oklahoma City Hotel marks the brand’s expansion into Oklahoma. The property consists of 78,000 square feet of flexible meeting, event and pre-function space and sits caddy-corner to a streetcar stop, placing the hotel right within the bustling community of downtown.

«Omni Hotels & Resorts is laser-focused on its development strategy and, despite the industry impacts of COVID-19, our expansion across the Red River reinforces our commitment to that strategy,» said Peter Strebel, president of Omni Hotels & Resorts. «We look forward to extending our genuine hospitality into this tenacious city and becoming a new addition to the downtown skyline that Oklahomans can be proud of. Each of our hotels are unique to the community, and Omni Oklahoma City Hotel is no different with a top-to-bottom design that authentically conveys the welcoming spirit of the city.»

The hotel’s design features elements that draw inspiration from the surrounding pastoral landscape of the Oklahoman terrain including layers of the earth and sky. Paying homage to the state and weaving in rustic, earthy tones that represent the prairie land and sunset, the property’s common areas, guest rooms, ballrooms and spa also embrace textured walls and components of wood, metal and chevron patterns that pay homage to the local industry; Oklahoma’s state bird, the Scissor-tailed flycatcher; and the economy of the city and its surroundings.

The hotel features 605 guest rooms, including 29 suites, with well-appointed furnishings, regional influences and dramatic views of Scissortail Park and the downtown skyline. Additionally, the hotel’s top 17th floor was designed to cater specifically to professional basketball players featuring California King beds, larger door frames and taller ceilings and shower heads.

Hotel amenities are available to locals, travelers and overnight guests. Hotel highlights include:

Food & Beverage: Omni Oklahoma City Hotel provides a variety of food and beverage outlets to anyone who walks through its doors. A perfect, culinary-forward experience for any occasion, the seven restaurant and bar outlets include Basin Bar, OKC Tap House, Bob’s Steak & Chop House and Park Grounds — which open with the hotel on Jan. 26 — in addition to Seltzer’s, Catbird Seat and Double Double Burger Bar, which will open at a later date.

Wellness: The full-service Mokara Spa, state-of-the-art fitness center and rooftop pool deck terrace will offer a premier and luxurious experience with personalized, exceptional service to all. Mokara Spa provides a tranquil relaxation lounge and features head-to-toe treatments, a revitalizing sauna and pampering nail services. Its design pulls inspiration from the state’s important commodity – cotton. The 24-hour fitness center is available to all guests and, located on the third floor, while the pool deck overlooks Scissortail Park providing beautiful, scenic views.

Meetings: Situated between the new convention center and Chesapeake Energy Arena, Omni Oklahoma City Hotel will be a nationwide destination for meetings and events. All 78,000 square feet of meeting space will be located on the second floor, with the exception of an outdoor event lawn on the third floor and a boardroom located on the 17th floor which can be used as a convenient and private meeting space for visiting NBA teams.

In the spirit of highlighting Oklahoma’s healthcare workers, Omni Oklahoma City Hotel is honored to recognize Charles Maines RN from INTEGRIS Southwest Hospital (INTEGRIS) as its first guest. Maines contracted COVID-19 earlier in 2020, successfully recovered and returned to work to continue treating patients battling COVID-19. As an inspiring leader to his team at INTEGRIS, Maines will also be enrolled as a lifetime member to Omni’s Select Guest ® Loyalty Program.

To add to the celebration, the office of Oklahoma City Mayor Holt proclaimed Tuesday, Jan. 26, 2021, as «Omni Oklahoma City Hotel Day.» The proclamation was read by Mayor Holt at the privately-held ribbon cutting event.

«The opening of the Omni in Oklahoma City is a continuation of an exciting chapter in downtown Oklahoma City’s ongoing transformation,» Mayor Holt said. «In partnership with the MAPS 3 convention center, Omni helps further propel our city to bring in new visitors, tax dollars and more.»

Omni Oklahoma City Hotel opens following Omni Hotels & Resorts’ Safe & Clean program. The initiative includes extensive cleaning guidelines, processes and procedures to ensure the health, safety and comfort of guests and associates. It is informed by the Centers for Disease Control and Prevention (CDC) guidelines and also meets the «Safe Stay» initiative set forth by the American Hotel & Lodging Association (AHLA).

The hotel is conveniently located in the heart of Oklahoma City with easy access to I-40 and the Will Rogers Airport. To book a stay, spa treatment, group meeting or event, visit omnihotels.com/hotels/oklahoma-city.

About Omni Hotels & Resorts
Omni Hotels & Resorts creates genuine, authentic guest experiences at 60 distinct luxury hotels and resorts in leading business and leisure destinations across North America. With more than 25 iconic golf courses and 16 award-winning spas featured in dynamic locales nationwide, every Omni proudly opens its doors to share the true spirit of its destination. Reflected through local color, personalized service, unique wellness options, signature restaurants and creative culinary offerings, Omni leaves a lasting impression with every guest and a heightened level of recognition and rewards delivered through its Select Guest® loyalty program. As a founding member of the Global Hotel Alliance, Select Guest is further expanded through the DISCOVERY loyalty program offering members additional global benefits. Omni is committed to reducing hunger and is on a mission through its Say Goodnight to Hunger initiative to provide millions of meals each year for food banks to feed children, families and seniors in communities in which it operates. Through its partnership with Shared Hope International, Omni is dedicated to the education and training of its associates to help combat human trafficking.

Omni Hotels & Resorts is the official hotel of the PGA TOUR® and PGA TOUR Champions. For information or to book accommodations, visit omnihotels.com or call 1-800-The-Omni.

Media Contact

Omni Contact:

Taylor Ketchum

Melissa Becker

(405) 834-2537

(972) 871-5556

Taylor@jones.pr

melissa.becker@omnihotels.com  

Cision View original content to download multimedia:http://www.prnewswire.com/news-releases/omni-oklahoma-city-hotel-proudly-opens-its-doors-to-the-oklahoma-city-community-301215141.html

SOURCE Omni Hotels & Resorts

TrueCar Forecasts New and Used Retail Sales Up Slightly Year-Over-Year for January 2021, While Fleet Recovery Drags

SANTA MONICA, Calif., Jan. 26, 2021 /PRNewswire/ — TrueCar, Inc. projects total new vehicle sales will reach 1,048,975 units in January 2021, down 4.4% from a year ago when adjusted for the same number of selling days. This month’s seasonally adjusted annualized rate (SAAR) for total light vehicle sales is an estimated 15.9…

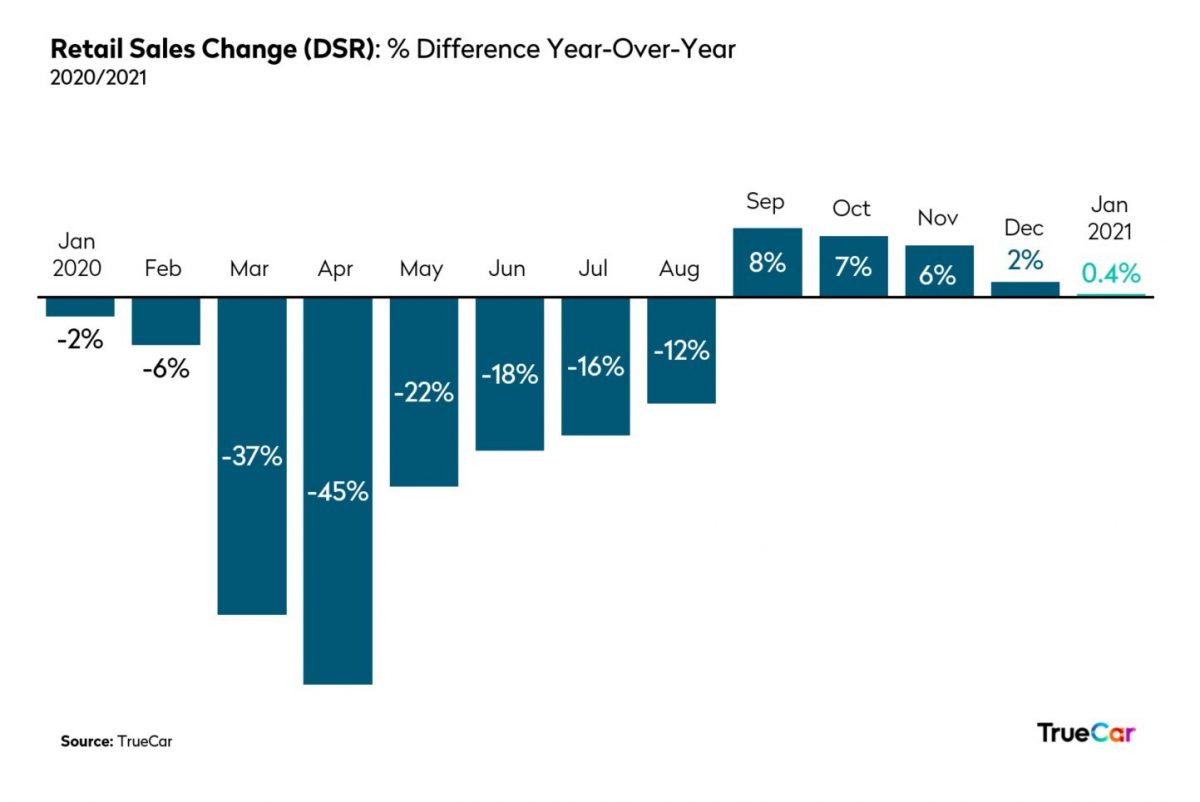
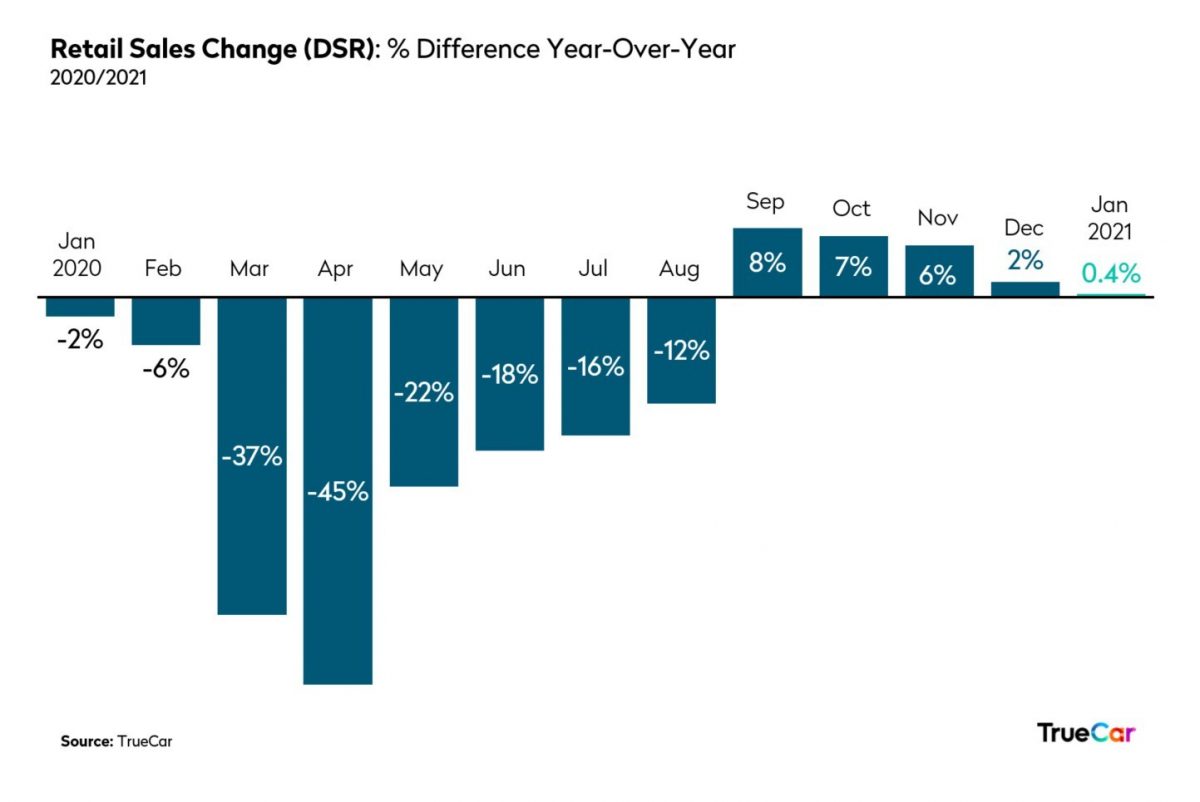
SANTA MONICA, Calif., Jan. 26, 2021 /PRNewswire/ — TrueCar, Inc. projects total new vehicle sales will reach 1,048,975 units in January 2021, down 4.4% from a year ago when adjusted for the same number of selling days. This month’s seasonally adjusted annualized rate (SAAR) for total light vehicle sales is an estimated 15.9 million units. Excluding fleet sales, TrueCar expects U.S. retail deliveries of new cars and light trucks to be 880,552 units, an increase of 0.4% from a year ago when adjusted for the same number of selling days. Used vehicle sales for January 2021 are expected to reach 3.2 million, up 1% from a year ago and up 10% from December 2020. 

«Entering 2021 with retail sales in line with last year is a big win for the automotive industry,» said Nick Woolard, Lead Industry Analyst at TrueCar. «However, while retail sales have rebounded, rental fleets remained depressed and continue to interrupt fleet sales. . As a result, fleet sales are struggling to come back to pre-pandemic levels and are driving total unit sales down.»

«The automotive industry continues to reap the benefits of continued strength in retail demand with lower incentive spend. A handful of brands such as Ford, Genesis, GMC, Ram and Toyota, appear to be in the coveted quadrant of both retail growth as well as incentive decline. This is mostly driven by new product and being in the right segments or a combination of the two,» added Woolard.

Average transaction prices (ATP) are projected to be up 4.2% or $1,509 from a year ago and down 4.5% or $1,759 from December 2020. TrueCar projects that U.S. revenue from new vehicle sales will reach approximately $39 billion for January 2021, down 4.4% (based on a non-adjusted daily selling rate) from a year ago and down 38.2% from last month.

«Average transaction prices have finally come down from the record-setting highs we saw last month, but are still higher than this time last year.  Of the bigger manufacturers, only Kia has an average transaction price below $30,000. We expect this trend to continue as consumers desire pricier trucks and SUVs,» said Alain Nana-Sinkam, Vice President of Industry Insights at TrueCar. «As new vehicle prices rise, we may see more price-conscious shoppers gravitate back towards smaller segments or the used car market due to growing concerns around affordability.»

Additional Insights (forecast by TrueCar):

  • Total retail sales for January 2021 are expected to be up 0.4% from a year ago and down 28.6% from December 2020 when adjusted for the same number of selling days.
  • Fleet sales for January 2021 are expected to be down 23.7% from a year ago and up 8% from December 2020 when adjusted for the same number of selling days.
  • Average transaction price is projected to be up 4.2% or $1,509 from a year ago and down 4.5% or $1,759 from December 2020.
  • Total SAAR is expected to decrease 5.5% from a year ago from 16.8 million units to 15.9 million units.
  • Used vehicle sales for January 2021 are expected to reach 3.2 million, up 1% from a year ago and up 10% from December 2020.
  • The average interest rate on new vehicles is 5.6% and the average interest rate on used vehicles is 8.1%.

January 2021 forecasts for the 13 largest manufacturers by volume. For additional data, visit the TrueCar Newsroom.

Total Unit Sales

Manufacturer

Jan 2021 Forecast

Jan 2020 Actual

Dec 2020 Actual

YoY % Change

YoY % Change

(Daily Selling Rate)

MoM % Change

MoM % Change      (Daily Selling Rate)

BMW

18,358

21,156

45,594

-13.2%

-9.6%

-59.7%

-53.0%

Daimler

15,405

24,111

35,436

-36.1%

-33.4%

-56.5%

-49.3%

Ford

143,106

156,041

208,007

-8.3%

-4.5%

-31.2%

-19.7%

GM

199,403

208,032

295,536

-4.1%

-0.2%

-32.5%

-21.3%

Honda

85,958

101,625

136,467

-15.4%

-11.9%

-37.0%

-26.5%

Hyundai

40,423

44,143

69,388

-8.4%

-4.6%

-41.7%

-32.0%

Kia

36,151

40,355

53,764

-10.4%

-6.7%

-32.8%

-21.6%

Nissan

67,641

80,698

98,638

-16.2%

-12.7%

-31.4%

-20.0%

Stellantis

124,961

135,239

202,371

-7.6%

-3.7%

-38.3%

-28.0%

Subaru

40,624

46,285

63,558

-12.2%

-8.6%

-36.1%

-25.4%

Tesla

26,156

22,350

26,950

17.0%

21.9%

-2.9%

13.2%

Toyota

169,836

166,973

251,256

1.7%

6.0%

-32.4%

-21.1%

Volkswagen Group

39,705

45,377

70,175

-12.5%

-8.9%

-43.4%

-34.0%

Industry

1,048,975

1,143,027

1,619,907

-8.2%

-4.4%

-35.2%

-24.5%

Retail Unit Sales

Manufacturer

Jan 2021 Forecast

Jan 2020 Actual

Dec 2020 Actual

YoY % Change

YoY % Change

(Daily Selling Rate)

MoM % Change

MoM % Change      (Daily Selling Rate)

BMW

17,885

19,578

44,801

-8.6%

-4.8%

-60.1%

-53.4%

Daimler

15,086

22,516

34,711

-33.0%

-30.2%

-56.5%

-49.3%

Ford

111,163

106,861

169,545

4.0%

8.4%

-34.4%

-23.5%

GM

150,681

147,866

256,921

1.9%

6.1%

-41.4%

-31.6%

Honda

85,485

100,679

135,896

-15.1%

-11.6%

-37.1%

-26.6%

Hyundai

35,967

36,720

60,849

-2.0%

2.0%

-40.9%

-31.0%

Kia

32,392

33,393

51,764

-3.0%

1.0%

-37.4%

-27.0%

Nissan

52,674

57,436

81,068

-8.3%

-4.5%

-35.0%

-24.2%

Stellantis

98,062

100,485

167,109

-2.4%

1.7%

-41.3%

-31.5%

Subaru

38,383

43,618

61,188

-12.0%

-8.3%

-37.3%

-26.8%

Tesla

26,144

22,350

26,941

17.0%

21.8%

-3.0%

13.2%

Toyota

143,997

140,984

222,710

2.1%

6.4%

-35.3%

-24.6%

Volkswagen Group

38,243

40,303

69,128

-5.1%

-1.2%

-44.7%

-35.5%

Industry

880,552

913,238

1,437,992

-3.6%

0.4%

-38.8%

-28.6%

Fleet Unit Sales

Manufacturer

Jan 2021 Forecast

Jan 2020 Actual

Dec 2020 Actual

YoY % Change

YoY % Change

(Daily Selling Rate)

MoM % Change

MoM % Change      (Daily Selling Rate)

BMW

472

1,578

793

-70.1%

-68.8%

-40.5%

-30.5%

Daimler

319

1,595

725

-80.0%

-79.2%

-56.0%

-48.7%

Ford

31,943

49,180

38,462

-35.0%

-32.3%

-17.0%

-3.1%

GM

48,722

60,166

38,615

-19.0%

-15.6%

26.2%

47.2%

Honda

473

946

571

-50.0%

-47.9%

-17.2%

-3.3%

Hyundai

4,456

7,423

8,539

-40.0%

-37.5%

-47.8%

-39.1%

Kia

3,759

6,962

2,000

-46.0%

-43.8%

87.9%

119.3%

Nissan

14,966

23,262

17,570

-35.7%

-33.0%

-14.8%

-0.6%

Stellantis

26,900

34,754

35,262

-22.6%

-19.4%

-23.7%

-11.0%

Subaru

2,241

2,667

2,370

-16.0%

-12.5%

-5.4%

10.3%

Tesla

12

–

9

–

–

30.6%

52.4%

Toyota

25,839

25,989

28,546

-0.6%

3.6%

-9.5%

5.6%

Volkswagen Group

1,462

5,074

1,047

-71.2%

-70.0%

39.7%

63.0%

Industry

168,423

229,789

181,915

-26.7%

-23.7%

-7.4%

8.0%

Fleet Penetration

Manufacturer

Jan 2021 Forecast

Jan 2020 Actual

Dec 2020 Actual

YoY % Change

MoM % Change

BMW

2.6%

7.5%

1.7%

-65.5%

47.9%

Daimler

2.1%

6.6%

2.0%

-68.7%

1.2%

Ford

22.3%

31.5%

18.5%

-29.2%

20.7%

GM

24.4%

28.9%

13.1%

-15.5%

87.0%

Honda

0.6%

0.9%

0.4%

-40.9%

31.5%

Hyundai

11.0%

16.8%

12.3%

-34.4%

-10.4%

Kia

10.4%

17.3%

3.7%

-39.7%

179.5%

Nissan

22.1%

28.8%

17.8%

-23.2%

24.2%

Stellantis

21.5%

25.7%

17.4%

-16.2%

23.5%

Subaru

5.5%

5.8%

3.7%

-4.3%

47.9%

Tesla

0.0%

0.0%

0.0%

34.6%

Toyota

15.2%

15.6%

11.4%

-2.3%

33.9%

Volkswagen Group

3.7%

11.2%

1.5%

-67.1%

146.9%

Industry

16.1%

20.1%

11.2%

-20.1%

43.0%

Total Market Share

Manufacturer

Jan 2021 Forecast

Jan 2020 Actual

Dec 2020 Actual

BMW

1.8%

1.9%

2.8%

Daimler

1.5%

2.1%

2.2%

Ford

13.6%

13.7%

12.8%

GM

19.0%

18.2%

18.2%

Honda

8.2%

8.9%

8.4%

Hyundai

3.9%

3.9%

4.3%

Kia

3.4%

3.5%

3.3%

Nissan

6.4%

7.1%

6.1%

Stellantis

11.9%

11.8%

12.5%

Subaru

3.9%

4.0%

3.9%

Tesla

2.5%

2.0%

1.7%

Toyota

16.2%

14.6%

15.5%

Volkswagen Group

3.8%

4.0%

4.3%

Retail Market Share

Manufacturer

Jan 2021 Forecast

Jan 2020 Actual

Dec 2020 Actual

BMW

2.0%

2.1%

3.1%

Daimler

1.7%

2.5%

2.4%

Ford

12.6%

11.7%

11.8%

GM

17.1%

16.2%

17.9%

Honda

9.7%

11.0%

9.5%

Hyundai

4.1%

4.0%

4.2%

Kia

3.7%

3.7%

3.6%

Nissan

6.0%

6.3%

5.6%

Stellantis

11.1%

11.0%

11.6%

Subaru

4.4%

4.8%

4.3%

Tesla

3.0%

2.4%

1.9%

Toyota

16.4%

15.4%

15.5%

Volkswagen Group

4.3%

4.4%

4.8%

Average Transaction Price (ATP)

Manufacturer

Jan 2021 Forecast

Jan 2020 Actual

Dec 2020 Actual

YOY

MOM

BMW

$58,473

$57,090

$59,710

2.4%

-2.1%

Daimler

$61,867

$60,853

$61,087

1.7%

1.3%

Ford

$43,580

$42,543

$44,354

2.4%

-1.7%

GM

$41,852

$39,522

$43,735

5.9%

-4.3%

Honda

$30,740

$29,220

$30,959

5.2%

-0.7%

Hyundai

$31,273

$28,324

$30,477

10.4%

2.6%

Kia

$28,204

$25,647

$28,137

10.0%

0.2%

Nissan

$30,068

$29,351

$29,965

2.4%

0.3%

Stellantis

$42,886

$40,590

$43,259

5.7%

-0.9%

Subaru

$30,564

$30,032

$30,789

1.8%

-0.7%

Toyota

$34,995

$33,379

$35,321

4.8%

-0.9%

Volkswagen Group

$43,040

$40,787

$42,920

5.5%

0.3%

Industry

$37,330

$35,821

$39,089

4.2%

-4.5%

Incentive Spending

Manufacturer

Jan 2021 Forecast

Jan 2020 Actual

Dec 2020 Actual

YOY

MOM

BMW

$4,687

$5,812

$5,233

-19.4%

-10.4%

Daimler

$4,187

$6,246

$4,438

-33.0%

-5.7%

Ford

$3,925

$4,926

$4,464

-20.3%

-12.1%

GM

$5,537

$5,673

$4,971

-2.4%

11.4%

Honda

$2,862

$2,520

$2,455

13.6%

16.6%

Hyundai

$2,281

$3,092

$2,536

-26.2%

-10.0%

Kia

$2,605

$3,686

$2,999

-29.3%

-13.1%

Nissan

$4,062

$4,842

$4,586

-16.1%

-11.4%

Stellantis

$5,284

$5,027

$4,681

5.1%

12.9%

Subaru

$1,512

$1,244

$1,505

21.5%

0.5%

Toyota

$2,466

$2,679

$2,755

-8.0%

-10.5%

Volkswagen Group

$3,754

$4,407

$4,256

-14.8%

-11.8%

Industry

$3,839

$4,151

$3,869

-7.5%

-0.8%

Incentives as a Percentage of Average Transaction Price (ATP)

Manufacturer

Jan 2021 Forecast

Jan 2020 Actual

Dec 2020 Actual

YOY

MOM

BMW

8.0%

10.2%

8.8%

-21.3%

-8.5%

Daimler

6.8%

10.3%

7.3%

-34.1%

-6.8%

Ford

9.0%

11.6%

10.1%

-22.2%

-10.5%

GM

13.2%

14.4%

11.4%

-7.8%

16.4%

Honda

9.3%

8.6%

7.9%

8.0%

17.4%

Hyundai

7.3%

10.9%

8.3%

-33.2%

-12.3%

Kia

9.2%

14.4%

10.7%

-35.7%

-13.3%

Nissan

13.5%

16.5%

15.3%

-18.1%

-11.7%

Stellantis

12.3%

12.4%

10.8%

-0.5%

13.9%

Subaru

4.9%

4.1%

4.9%

19.4%

1.2%

Toyota

7.0%

8.0%

7.8%

-12.2%

-9.7%

Volkswagen Group

8.7%

10.8%

9.9%

-19.3%

-12.0%

Industry

10.3%

11.6%

9.9%

-11.2%

3.9%

(Note: This forecast is based solely on TrueCar, Inc.’s analysis of industry sales trends and conditions and is not a projection of TrueCar, Inc.’s operations.)

About TrueCar
TrueCar is a leading automotive digital marketplace that enables car buyers to connect to our nationwide network of Certified Dealers. We are building the industry’s most personalized and efficient car buying experience as we seek to bring more of the purchasing process online. Consumers who visit our marketplace will find a suite of vehicle discovery tools, price ratings, and market context on new and used cars – all with a clear view of what’s a great deal. When they are ready, TrueCar will enable them to connect with a local Certified Dealer who shares in our belief that truth, transparency, and fairness are the foundation of a great car buying experience. As part of our marketplace, TrueCar powers car-buying programs for over 250 leading brands, including AARP, Sam’s Club, and American Express. Nearly half of all new-car buyers engage with TrueCar powered sites, where they buy smarter and drive happier. TrueCar is headquartered in Santa Monica, California, with offices in Austin, Texas, and Boston, Massachusetts.

For more information, please visit www.truecar.com, and follow us on Facebook or Twitter. TrueCar media line: +1-844-469-8442 (US toll-free) | Email: pr@truecar.com 

TrueCar PR Contacts:
Shadee Malekafzali
shadee@truecar.com
424.258.8694

Tanya Kohan
tkohan@truecar.com
714.425.6319

Cision View original content to download multimedia:http://www.prnewswire.com/news-releases/truecar-forecasts-new-and-used-retail-sales-up-slightly-year-over-year-for-january-2021-while-fleet-recovery-drags-301214612.html

SOURCE Truecar, Inc.

New Study: Propane Outpaces Electric For Carbon Footprint In Trucks

WASHINGTON, Jan. 26, 2021 /PRNewswire/ — A new comparative analysis out today analyzes the carbon footprint of medium-duty and heavy-duty (MD-HD) engine vehicles powered by propane and electricity. The analysis,

WASHINGTON, Jan. 26, 2021 /PRNewswire/ — A new comparative analysis out today analyzes the carbon footprint of medium-duty and heavy-duty (MD-HD) engine vehicles powered by propane and electricity. The analysis, Decarbonization of MD-HD Vehicles with Propane, found that propane-fueled MD-HD internal combustion engine vehicles provide a lower carbon footprint solution in 38 U.S. states and Washington, D.C., when compared to MD-HD electric vehicles (EVs) charged using the electrical grid.

Fifteen states and Washington, D.C., have proposed full electrification of medium- and heavy-duty trucks by 2050 with a target of 30 percent «zero-emission» vehicle sales by 2030. The rationale behind the proposals is based on the dubious assumption that the electrical grid will be fully decarbonized by that time. Likewise, policy based on exhaust carbon dioxide (CO2eq) emissions alone as opposed to life-cycle analysis results misses the full picture. As a result, policy proposals today conflate the promise of electrification with actual decarbonization.

The comparative analysis also reveals that MD-HD vehicles powered by renewable propane provide a lower carbon footprint solution in every U.S. state except Vermont where electricity is generated by, and imported from, Canadian hydroelectric power plants. Renewable propane is derived from sources such as beef fats, vegetable oils, grease residue, and other biomass feedstocks.

Moreover, the analysis shows that decarbonization can be accelerated by adopting propane as the fuel of choice for MD-HD vehicles. The conclusion is supported by a life-cycle analysis of equivalent CO2eq emissions between electric and propane-fueled vehicles across the U.S. using CARB carbon intensity values along with a powertrain efficiency analysis.

«It’s often assumed that full electrification of all sectors will lead to their full decarbonization, but little thought on how electricity is currently generated, stored, transmitted, and consumed has been considered,» said the author Dr. Gokul Vishwanathan, director of research & sustainability at the Propane Education & Research Council. «While a fully renewable-based electric grid is not feasible anytime soon, propane is an effective solution today for accelerating decarbonization of transportation and other energy sectors.»

The comparative analysis presented the following decarbonization recommendations:

  • All 50 states should aggressively invest resources in incentivizing renewable fuels.
  • Federal government agencies, particularly the Department of Energy, should aggressively invest in various parallel pathways for renewable and synthetic fuel production to ensure supply.
  • The U.S. should aggressively pursue immediately available decarbonization efforts using alternative fuels such as propane and dimethyl ether (DME) rather than wait on grid infrastructure improvements that are decades away from realization.

About PERC: The Propane Education & Research Council is a nonprofit that provides leading propane safety and training programs and invests in research and development of new propane-powered technologies. PERC is operated and funded by the propane industry. For more information, visit Propane.com.

Contact:          

David Gibbs representing PERC

dgibbs@hahnpublic.com


Cision View original content to download multimedia:http://www.prnewswire.com/news-releases/new-study-propane-outpaces-electric-for-carbon-footprint-in-trucks-301211874.html

SOURCE Propane Education & Research Council

PRO Unlimited and Eightfold AI Announce Exclusive Partnership to Bring AI and Diversity & Inclusion to Modern Workforce Management

SAN FRANCISCO, Jan. 26, 2021 /PRNewswire/ — PRO Unlimited, the pioneer and leading modern workforce management solution provider in the industry, announced today an exclusive partnership with…

SAN FRANCISCO, Jan. 26, 2021 /PRNewswire/ — PRO Unlimited, the pioneer and leading modern workforce management solution provider in the industry, announced today an exclusive partnership with Eightfold AI, a talent intelligence pioneer and leader. Under the terms of the partnership, PRO will embed Eightfold’s AI technology into its contingent workforce management platform, including SaaS solutions, such as Wand Vendor Management System (VMS), Direct Sourcing and Diversity and Inclusion (D&I) offerings, to optimize its customers’ contingent hiring practices. Eightfold’s AI-driven talent intelligence, coupled with PRO’s 30 years of data and technology, will also increase the power of PRO’s contingent workforce management platform. It will enable the Global 2000 to more effectively and intelligently identify, engage and secure the best contingent talent in the world, while attaining diversity goals.  

As the economy rebounds, organizations will be hiring contingent workers ahead of the recovery while prioritizing areas within hiring, such as retention and D&I initiatives. However, many organizations lack the ability to harness machine-based learning, data and intelligence to not only source the best candidates, but also to drive their businesses forward. Eightfold AI’s talent intelligence and PRO’s contingent workforce management platform, including the world’s largest global market rate data repository, aim to solve this problem, which is one of the biggest pain points for companies today. 

PRO will embed Eightfold’s AI technology into its software to provide customers with features that enable more informed hiring, diversity and redeployment of workers anywhere in the world. This real-time matching and ranking of candidates drives faster, smarter hiring decisions at scale. This helps organizations secure the best talent, while reducing costs and increasing D&I. Managers eager to reduce manual tasks and increase efficiency will be able to more quickly and effectively identify candidates that align with a job’s requirements. Leading-edge job calibration capabilities and intuitive UI design offer these managers an easy, at-a-glance way to compare candidates side-by-side based on unbiased empirical data.

Using Eightfold AI’s technology, PRO will also be able to offer direct sourcing to its customers. This dramatically improves the experience that contingent specialty-skilled, white-collar workers go through during the hiring process, and will ultimately improve the Global 2000’s contingent worker brands. 

«Today, the modern workforce is massive, with roughly 43% of all skilled white-collar workers being contingent vs. full-time employees. Many organizations are aggressively and strategically pushing that number to 50% or 60% while simultaneously shifting to more and more diverse candidates. Within this expanding workforce segment, there is a huge opportunity to harvest the enormous amount of PRO’s data, deploy world-class machine-based learning to that data, and ultimately utilize it to make the process, quality, intelligence and cost of this massive modern workforce far superior than it is today,» said Kevin Akeroyd, CEO of PRO Unlimited. «We are excited to partner with a company that uses industry-leading AI technology to truly understand a candidate’s skill set or D&I attributes while generating recommendations to help inform hiring decisions.» 

Akeroyd added: «This is truly a game changer for our space. It will transform how our customers, which include some of the largest brands globally, source, develop and redeploy their workforces while lowering costs. Partnering exclusively in the contingent industry with this innovative talent intelligence company is something we are incredibly excited about.»

Eightfold AI’s talent intelligence platform brings together billions of anonymized data points, algorithms and domain expertise to make a reliable, scalable impact for enterprise organizations. The platform combines internal data with publicly available insights to predict future roles, as well as identify validated skills, likely skills and missing skills – speeding up the process substantially. Its AI technology uses the career paths of more than one billion profiles. This results in 90% less time screening, 80% faster time to interview, 70% more top candidates, 60% lower cost to hire, and due to its gender/anonymous evaluations, 0% bias. This is critical as Eightfold’s demographic-masking capabilities and its unique diversity analytics help block the biases in traditional hiring, understand barriers for candidates and create accountability. With the addition of the Eightfold partnership, PRO will offer an unparalleled suite of diversity offerings for the contingent workforce. 

«Partnering with PRO Unlimited is perfectly aligned with our mission of providing the right career to everyone in the world,» said Ashutosh Garg, Founder and CEO of Eightfold AI. «Together, we are able to bring Eightfold’s unique expertise and capability working with full-time employment to an entirely new, critical segment of customers in the rapidly growing, strategic, contingent workforce space.»

PRO’s embedding of Eightfold AI’s technology will roll out initially in Q1 2021 and iterate rapidly, driving continuous improvement and value creation, and be available for all PRO customers. 

About PRO Unlimited
PRO Unlimited offers the industry’s most comprehensive and holistic platform for contingent workforce management, and helps organizations around the world address the costs, risks and quality issues associated with managing the non-employee workforce. PRO’s platform consists of integrated SaaS software and services solutions that are built on the world’s most robust contingent workforce data set, spanning over 30 years. A pioneer and innovator in the industry, PRO’s platform provides solutions for the procurement and management of contingent labor, global rate intelligence, direct sourcing, 1099/co-employment risk management, third-party payroll, and diversity and inclusion. http://www.prounlimited.com

About Eightfold AI

Eightfold AI® delivers the Talent Intelligence Platform™, the most effective way for organizations to retain top performers, upskill and reskill the workforce, recruit top talent efficiently, and reach diversity goals. Eightfold AI’s deep learning artificial intelligence platform empowers enterprises to turn talent management into a competitive advantage. For more information, visit www.eightfold.ai. 


Cision View original content to download multimedia:http://www.prnewswire.com/news-releases/pro-unlimited-and-eightfold-ai-announce-exclusive-partnership-to-bring-ai-and-diversity–inclusion-to-modern-workforce-management-301214738.html

SOURCE PRO Unlimited

TrueCar Forecasts New and Used Retail Sales Up Slightly Year-Over-Year for January 2021, While Fleet Recovery Drags

SANTA MONICA, Calif., Jan. 26, 2021 /PRNewswire/ — TrueCar, Inc. projects total new vehicle sales will reach 1,048,975 units in January 2021, down 4.4% from a year ago when adjusted for the same number of selling days. This month’s seasonally adjusted annualized rate (SAAR) for total light vehicle sales is an estimated 15.9…

SANTA MONICA, Calif., Jan. 26, 2021 /PRNewswire/ — TrueCar, Inc. projects total new vehicle sales will reach 1,048,975 units in January 2021, down 4.4% from a year ago when adjusted for the same number of selling days. This month’s seasonally adjusted annualized rate (SAAR) for total light vehicle sales is an estimated 15.9 million units. Excluding fleet sales, TrueCar expects U.S. retail deliveries of new cars and light trucks to be 880,552 units, an increase of 0.4% from a year ago when adjusted for the same number of selling days. Used vehicle sales for January 2021 are expected to reach 3.2 million, up 1% from a year ago and up 10% from December 2020. 

«Entering 2021 with retail sales in line with last year is a big win for the automotive industry,» said Nick Woolard, Lead Industry Analyst at TrueCar. «However, while retail sales have rebounded, rental fleets remained depressed and continue to interrupt fleet sales. . As a result, fleet sales are struggling to come back to pre-pandemic levels and are driving total unit sales down.»

«The automotive industry continues to reap the benefits of continued strength in retail demand with lower incentive spend. A handful of brands such as Ford, Genesis, GMC, Ram and Toyota, appear to be in the coveted quadrant of both retail growth as well as incentive decline. This is mostly driven by new product and being in the right segments or a combination of the two,» added Woolard.

Average transaction prices (ATP) are projected to be up 4.2% or $1,509 from a year ago and down 4.5% or $1,759 from December 2020. TrueCar projects that U.S. revenue from new vehicle sales will reach approximately $39 billion for January 2021, down 4.4% (based on a non-adjusted daily selling rate) from a year ago and down 38.2% from last month.

«Average transaction prices have finally come down from the record-setting highs we saw last month, but are still higher than this time last year.  Of the bigger manufacturers, only Kia has an average transaction price below $30,000. We expect this trend to continue as consumers desire pricier trucks and SUVs,» said Alain Nana-Sinkam, Vice President of Industry Insights at TrueCar. «As new vehicle prices rise, we may see more price-conscious shoppers gravitate back towards smaller segments or the used car market due to growing concerns around affordability.»

Additional Insights (forecast by TrueCar):

  • Total retail sales for January 2021 are expected to be up 0.4% from a year ago and down 28.6% from December 2020 when adjusted for the same number of selling days.
  • Fleet sales for January 2021 are expected to be down 23.7% from a year ago and up 8% from December 2020 when adjusted for the same number of selling days.
  • Average transaction price is projected to be up 4.2% or $1,509 from a year ago and down 4.5% or $1,759 from December 2020.
  • Total SAAR is expected to decrease 5.5% from a year ago from 16.8 million units to 15.9 million units.
  • Used vehicle sales for January 2021 are expected to reach 3.2 million, up 1% from a year ago and up 10% from December 2020.
  • The average interest rate on new vehicles is 5.6% and the average interest rate on used vehicles is 8.1%.

January 2021 forecasts for the 13 largest manufacturers by volume. For additional data, visit the TrueCar Newsroom.

Total Unit Sales

Manufacturer

Jan 2021 Forecast

Jan 2020 Actual

Dec 2020 Actual

YoY % Change

YoY % Change

(Daily Selling Rate)

MoM % Change

MoM % Change      (Daily Selling Rate)

BMW

18,358

21,156

45,594

-13.2%

-9.6%

-59.7%

-53.0%

Daimler

15,405

24,111

35,436

-36.1%

-33.4%

-56.5%

-49.3%

Ford

143,106

156,041

208,007

-8.3%

-4.5%

-31.2%

-19.7%

GM

199,403

208,032

295,536

-4.1%

-0.2%

-32.5%

-21.3%

Honda

85,958

101,625

136,467

-15.4%

-11.9%

-37.0%

-26.5%

Hyundai

40,423

44,143

69,388

-8.4%

-4.6%

-41.7%

-32.0%

Kia

36,151

40,355

53,764

-10.4%

-6.7%

-32.8%

-21.6%

Nissan

67,641

80,698

98,638

-16.2%

-12.7%

-31.4%

-20.0%

Stellantis

124,961

135,239

202,371

-7.6%

-3.7%

-38.3%

-28.0%

Subaru

40,624

46,285

63,558

-12.2%

-8.6%

-36.1%

-25.4%

Tesla

26,156

22,350

26,950

17.0%

21.9%

-2.9%

13.2%

Toyota

169,836

166,973

251,256

1.7%

6.0%

-32.4%

-21.1%

Volkswagen Group

39,705

45,377

70,175

-12.5%

-8.9%

-43.4%

-34.0%

Industry

1,048,975

1,143,027

1,619,907

-8.2%

-4.4%

-35.2%

-24.5%

Retail Unit Sales

Manufacturer

Jan 2021 Forecast

Jan 2020 Actual

Dec 2020 Actual

YoY % Change

YoY % Change

(Daily Selling Rate)

MoM % Change

MoM % Change      (Daily Selling Rate)

BMW

17,885

19,578

44,801

-8.6%

-4.8%

-60.1%

-53.4%

Daimler

15,086

22,516

34,711

-33.0%

-30.2%

-56.5%

-49.3%

Ford

111,163

106,861

169,545

4.0%

8.4%

-34.4%

-23.5%

GM

150,681

147,866

256,921

1.9%

6.1%

-41.4%

-31.6%

Honda

85,485

100,679

135,896

-15.1%

-11.6%

-37.1%

-26.6%

Hyundai

35,967

36,720

60,849

-2.0%

2.0%

-40.9%

-31.0%

Kia

32,392

33,393

51,764

-3.0%

1.0%

-37.4%

-27.0%

Nissan

52,674

57,436

81,068

-8.3%

-4.5%

-35.0%

-24.2%

Stellantis

98,062

100,485

167,109

-2.4%

1.7%

-41.3%

-31.5%

Subaru

38,383

43,618

61,188

-12.0%

-8.3%

-37.3%

-26.8%

Tesla

26,144

22,350

26,941

17.0%

21.8%

-3.0%

13.2%

Toyota

143,997

140,984

222,710

2.1%

6.4%

-35.3%

-24.6%

Volkswagen Group

38,243

40,303

69,128

-5.1%

-1.2%

-44.7%

-35.5%

Industry

880,552

913,238

1,437,992

-3.6%

0.4%

-38.8%

-28.6%

Fleet Unit Sales

Manufacturer

Jan 2021 Forecast

Jan 2020 Actual

Dec 2020 Actual

YoY % Change

YoY % Change

(Daily Selling Rate)

MoM % Change

MoM % Change      (Daily Selling Rate)

BMW

472

1,578

793

-70.1%

-68.8%

-40.5%

-30.5%

Daimler

319

1,595

725

-80.0%

-79.2%

-56.0%

-48.7%

Ford

31,943

49,180

38,462

-35.0%

-32.3%

-17.0%

-3.1%

GM

48,722

60,166

38,615

-19.0%

-15.6%

26.2%

47.2%

Honda

473

946

571

-50.0%

-47.9%

-17.2%

-3.3%

Hyundai

4,456

7,423

8,539

-40.0%

-37.5%

-47.8%

-39.1%

Kia

3,759

6,962

2,000

-46.0%

-43.8%

87.9%

119.3%

Nissan

14,966

23,262

17,570

-35.7%

-33.0%

-14.8%

-0.6%

Stellantis

26,900

34,754

35,262

-22.6%

-19.4%

-23.7%

-11.0%

Subaru

2,241

2,667

2,370

-16.0%

-12.5%

-5.4%

10.3%

Tesla

12

–

9

–

–

30.6%

52.4%

Toyota

25,839

25,989

28,546

-0.6%

3.6%

-9.5%

5.6%

Volkswagen Group

1,462

5,074

1,047

-71.2%

-70.0%

39.7%

63.0%

Industry

168,423

229,789

181,915

-26.7%

-23.7%

-7.4%

8.0%

Fleet Penetration

Manufacturer

Jan 2021 Forecast

Jan 2020 Actual

Dec 2020 Actual

YoY % Change

MoM % Change

BMW

2.6%

7.5%

1.7%

-65.5%

47.9%

Daimler

2.1%

6.6%

2.0%

-68.7%

1.2%

Ford

22.3%

31.5%

18.5%

-29.2%

20.7%

GM

24.4%

28.9%

13.1%

-15.5%

87.0%

Honda

0.6%

0.9%

0.4%

-40.9%

31.5%

Hyundai

11.0%

16.8%

12.3%

-34.4%

-10.4%

Kia

10.4%

17.3%

3.7%

-39.7%

179.5%

Nissan

22.1%

28.8%

17.8%

-23.2%

24.2%

Stellantis

21.5%

25.7%

17.4%

-16.2%

23.5%

Subaru

5.5%

5.8%

3.7%

-4.3%

47.9%

Tesla

0.0%

0.0%

0.0%

34.6%

Toyota

15.2%

15.6%

11.4%

-2.3%

33.9%

Volkswagen Group

3.7%

11.2%

1.5%

-67.1%

146.9%

Industry

16.1%

20.1%

11.2%

-20.1%

43.0%

Total Market Share

Manufacturer

Jan 2021 Forecast

Jan 2020 Actual

Dec 2020 Actual

BMW

1.8%

1.9%

2.8%

Daimler

1.5%

2.1%

2.2%

Ford

13.6%

13.7%

12.8%

GM

19.0%

18.2%

18.2%

Honda

8.2%

8.9%

8.4%

Hyundai

3.9%

3.9%

4.3%

Kia

3.4%

3.5%

3.3%

Nissan

6.4%

7.1%

6.1%

Stellantis

11.9%

11.8%

12.5%

Subaru

3.9%

4.0%

3.9%

Tesla

2.5%

2.0%

1.7%

Toyota

16.2%

14.6%

15.5%

Volkswagen Group

3.8%

4.0%

4.3%

Retail Market Share

Manufacturer

Jan 2021 Forecast

Jan 2020 Actual

Dec 2020 Actual

BMW

2.0%

2.1%

3.1%

Daimler

1.7%

2.5%

2.4%

Ford

12.6%

11.7%

11.8%

GM

17.1%

16.2%

17.9%

Honda

9.7%

11.0%

9.5%

Hyundai

4.1%

4.0%

4.2%

Kia

3.7%

3.7%

3.6%

Nissan

6.0%

6.3%

5.6%

Stellantis

11.1%

11.0%

11.6%

Subaru

4.4%

4.8%

4.3%

Tesla

3.0%

2.4%

1.9%

Toyota

16.4%

15.4%

15.5%

Volkswagen Group

4.3%

4.4%

4.8%

Average Transaction Price (ATP)

Manufacturer

Jan 2021 Forecast

Jan 2020 Actual

Dec 2020 Actual

YOY

MOM

BMW

$58,473

$57,090

$59,710

2.4%

-2.1%

Daimler

$61,867

$60,853

$61,087

1.7%

1.3%

Ford

$43,580

$42,543

$44,354

2.4%

-1.7%

GM

$41,852

$39,522

$43,735

5.9%

-4.3%

Honda

$30,740

$29,220

$30,959

5.2%

-0.7%

Hyundai

$31,273

$28,324

$30,477

10.4%

2.6%

Kia

$28,204

$25,647

$28,137

10.0%

0.2%

Nissan

$30,068

$29,351

$29,965

2.4%

0.3%

Stellantis

$42,886

$40,590

$43,259

5.7%

-0.9%

Subaru

$30,564

$30,032

$30,789

1.8%

-0.7%

Toyota

$34,995

$33,379

$35,321

4.8%

-0.9%

Volkswagen Group

$43,040

$40,787

$42,920

5.5%

0.3%

Industry

$37,330

$35,821

$39,089

4.2%

-4.5%

Incentive Spending

Manufacturer

Jan 2021 Forecast

Jan 2020 Actual

Dec 2020 Actual

YOY

MOM

BMW

$4,687

$5,812

$5,233

-19.4%

-10.4%

Daimler

$4,187

$6,246

$4,438

-33.0%

-5.7%

Ford

$3,925

$4,926

$4,464

-20.3%

-12.1%

GM

$5,537

$5,673

$4,971

-2.4%

11.4%

Honda

$2,862

$2,520

$2,455

13.6%

16.6%

Hyundai

$2,281

$3,092

$2,536

-26.2%

-10.0%

Kia

$2,605

$3,686

$2,999

-29.3%

-13.1%

Nissan

$4,062

$4,842

$4,586

-16.1%

-11.4%

Stellantis

$5,284

$5,027

$4,681

5.1%

12.9%

Subaru

$1,512

$1,244

$1,505

21.5%

0.5%

Toyota

$2,466

$2,679

$2,755

-8.0%

-10.5%

Volkswagen Group

$3,754

$4,407

$4,256

-14.8%

-11.8%

Industry

$3,839

$4,151

$3,869

-7.5%

-0.8%

Incentives as a Percentage of Average Transaction Price (ATP)

Manufacturer

Jan 2021 Forecast

Jan 2020 Actual

Dec 2020 Actual

YOY

MOM

BMW

8.0%

10.2%

8.8%

-21.3%

-8.5%

Daimler

6.8%

10.3%

7.3%

-34.1%

-6.8%

Ford

9.0%

11.6%

10.1%

-22.2%

-10.5%

GM

13.2%

14.4%

11.4%

-7.8%

16.4%

Honda

9.3%

8.6%

7.9%

8.0%

17.4%

Hyundai

7.3%

10.9%

8.3%

-33.2%

-12.3%

Kia

9.2%

14.4%

10.7%

-35.7%

-13.3%

Nissan

13.5%

16.5%

15.3%

-18.1%

-11.7%

Stellantis

12.3%

12.4%

10.8%

-0.5%

13.9%

Subaru

4.9%

4.1%

4.9%

19.4%

1.2%

Toyota

7.0%

8.0%

7.8%

-12.2%

-9.7%

Volkswagen Group

8.7%

10.8%

9.9%

-19.3%

-12.0%

Industry

10.3%

11.6%

9.9%

-11.2%

3.9%

(Note: This forecast is based solely on TrueCar, Inc.’s analysis of industry sales trends and conditions and is not a projection of TrueCar, Inc.’s operations.)

About TrueCar
TrueCar is a leading automotive digital marketplace that enables car buyers to connect to our nationwide network of Certified Dealers. We are building the industry’s most personalized and efficient car buying experience as we seek to bring more of the purchasing process online. Consumers who visit our marketplace will find a suite of vehicle discovery tools, price ratings, and market context on new and used cars – all with a clear view of what’s a great deal. When they are ready, TrueCar will enable them to connect with a local Certified Dealer who shares in our belief that truth, transparency, and fairness are the foundation of a great car buying experience. As part of our marketplace, TrueCar powers car-buying programs for over 250 leading brands, including AARP, Sam’s Club, and American Express. Nearly half of all new-car buyers engage with TrueCar powered sites, where they buy smarter and drive happier. TrueCar is headquartered in Santa Monica, California, with offices in Austin, Texas, and Boston, Massachusetts.

For more information, please visit www.truecar.com, and follow us on Facebook or Twitter. TrueCar media line: +1-844-469-8442 (US toll-free) | Email: pr@truecar.com 

TrueCar PR Contacts:
Shadee Malekafzali
shadee@truecar.com
424.258.8694

Tanya Kohan
tkohan@truecar.com
714.425.6319

Cision View original content to download multimedia:http://www.prnewswire.com/news-releases/truecar-forecasts-new-and-used-retail-sales-up-slightly-year-over-year-for-january-2021-while-fleet-recovery-drags-301214612.html

SOURCE Truecar, Inc.

Toyota Research Institute Launches Next Phase of Collaborative Research With Diverse Roster of World-Class Academic Institutions

LOS ALTOS, Calif., Jan. 26, 2021 /PRNewswire/ — The Toyota Research Institute (TRI) announced today that it has selected 13 additional academic institutions to participate in the next five-year phase of its collaborative research program. These universities join MIT, Stanford and the University of Michigan which have worked with TRI over the last five years to expand the body of research into artificial intelligence…

LOS ALTOS, Calif., Jan. 26, 2021 /PRNewswire/ — The Toyota Research Institute (TRI) announced today that it has selected 13 additional academic institutions to participate in the next five-year phase of its collaborative research program. These universities join MIT, Stanford and the University of Michigan which have worked with TRI over the last five years to expand the body of research into artificial intelligence (AI) with the goal of amplifying the human experience.

The next five-year phase includes investing more than $75 million in the academic institutions, making it one of the largest collaborative research programs by an automotive company in the world.

«Our first five-year program pushed the boundaries of exploratory research across multiple fields, generating 69 patent applications and nearly 650 papers,» said Eric Krotkov, TRI Chief Science Officer who leads the university research program. «Our next five years are about pushing even further and doing so with a broader, more diverse set of stakeholders.  To get to the best ideas, collaboration is critical.  Our aim is to build a pipeline of new ideas from different perspectives and underrepresented voices that share our vision of using AI for human amplification and societal good.»   

The following universities completed a comprehensive proposal submission and review process and will participate in the next phase of TRI’s collaborative research program: 

  1. Carnegie Mellon University
  2. Columbia University
  3. Florida A&M University–Florida State University College of Engineering
  4. Georgia Institute of Technology (Georgia Tech)
  5. Indiana University
  6. Massachusetts Institute Technology (MIT)
  7. Princeton University
  8. Smith College
  9. Stanford University
  10. Toyota Technological Institute at Chicago (TTIC)
  11. University of California, Berkeley
  12. University of Illinois
  13. University of Michigan
  14. University of Minnesota
  15. University of Pennsylvania
  16. UCLA

Through this program, TRI will lead 35 joint research projects focused on achieving breakthroughs around difficult technological challenges in TRI’s research areas: Automated Driving, Robotics and Machine Assisted Cognition (MAC). 

The primary objectives of the joint research projects are to:

  • Contribute significant new knowledge and understanding to the artificial intelligence field.
  • Demonstrate the potential to radically advance state of the art concepts into possible use cases.
  • Promote the transfer of knowledge through the meaningful exchange of scientific and technical information between TRI researchers and academic partners.
  • Create and share infrastructure, including data and software, to further research, promote reproducibility and support education.

The first phase of the program, conducted over the last five years, sponsored 98 projects involving about 100 faculty members and over 200 students. These projects yielded important technology advances for ongoing TRI projects, including transfer learning in computer vision, self-supervised learning on contact-rich tasks, and techniques for mimicking human behavior in various driving interactions. The projects generated several awards for published papers at leading conferences including the CVPR 2018 Best Paper, an ICRA 2019 Finalist Best Paper, the ICRA 2019 Best Paper, and the 2020 IEEE Robotics and Automation Letters Best Paper Award. Additionally, the close collaborations resulted in the recruitment of several new TRI team members.

This next five-year phase focuses investments in projects TRI researchers have a keen academic interest in exploring to create more value and impact for TRI. Each project features a TRI researcher as a co-investigator who will work with the university partner. This approach directly engages TRI researchers with the academic AI partners and ensures that the research contributes to the TRI mission.

TRI is also offering Young Faculty Researcher (YFR) projects to form partnerships with more junior (typically pre-tenure) faculty members. Whereas joint projects have TRI pursuing a specific direction and reaching technical milestones along the way, the YFR projects are specifically designed to support promising tenure stream faculty members, enabling them to explore broadly, inquire deeply, and address higher-risk, higher-payoff ideas. In YFR projects, TRI invests in the researcher and provides them with the freedom and flexibility to pivot from one direction to another.  

About Toyota Research Institute
Toyota Research Institute (TRI), established in 2015, aims to develop active vehicle safety and automated driving technologies, robotics, and other human amplification technology.  Led by Dr. Gill Pratt, TRI’s researchers use artificial intelligence to benefit society and improve the human condition by creating a future where everyone has the freedom to move, engage, and explore. TRI is based in the United States, with offices in Los Altos, California, Cambridge, Massachusetts, and Ann Arbor, Michigan. For more information about TRI, please visit http://tri.global.

Media Contacts

Stephen Hughes
Communications Mgr
Toyota Research Institute
Stephen.Hughes@tri.global
650-422-8947

Wendy Rosen
Communications Dir.
Toyota Research Institute
Wendy.Rosen@tri.global
650-284-6429

Cision View original content to download multimedia:http://www.prnewswire.com/news-releases/toyota-research-institute-launches-next-phase-of-collaborative-research-with-diverse-roster-of-world-class-academic-institutions-301215071.html

SOURCE Toyota Research Institute

VinSolutions Introduces Its Automotive Marketing Platform to Help Dealers Take Charge of Their Campaigns

MISSION, Kan., Jan. 26, 2021 /PRNewswire/ — Dealers share a common goal to engage customers and maximize profits but doing so efficiently while minimizing marketing spend can prove challenging. With the new Automotive Marketing Platform powered by…

MISSION, Kan., Jan. 26, 2021 /PRNewswire/ — Dealers share a common goal to engage customers and maximize profits but doing so efficiently while minimizing marketing spend can prove challenging. With the new Automotive Marketing Platform powered by VinSolutions, dealers can elevate their marketing without increasing their workload. Automotive Marketing Platform is a marketing tool that integrates with the CRM providing an end-to-end view across marketing and sales. This enables dealers to leverage data insights and automate workflows to deliver personalized experiences across the ownership lifecycle. Ultimately, Automotive Marketing Platform is the complete package for driving consumer engagement and helping to maximize ROI.

«Until now, dealerships had to manage campaigns across different departments, vendors and marketing channels, which inevitably created inconsistencies, depleted resources and compressed ROI,» said Tracy Fred, vice president of operations for Cox Automotive brands VinSolutions, Xtime and Dealertrack DMS. «With centralization and automation, Automotive Marketing Platform addresses the reality that two-thirds of a salesperson’s time is typically spent on non-revenue-generating activities like managing different tools across departments and duplicate data entry.1«

Automotive Marketing Platform helps protect dealership revenue with improved customer engagement, greater efficiency in marketing spend, increased marketing reach across departments, time-saving automation and centralization, and superior campaign performance. Key features include:

  • CRM Integration: Marketing activity is stored directly in the customer record in VinSolutions’ Connect dealership CRM instead of another tool, making it easier to guide personalized conversations, determine next steps and avoid duplicated efforts that frustrate customers and team members alike.
  • Automated Marketing Workflows: Marketing outreach is informed by data science and real customer behaviors, creating a series of «if, then» scenarios throughout the process that allows communication to be both automated and personalized.
  • Data Insights: Cox Automotive proprietary data identifies the types of customers who are most likely to be ready to buy based on their online behavior, maximizing sales opportunities, and proactively converting leads before they are even submitted.
  • Automated Offers Engine: With access to customer data from Kelley Blue Book and Autotrader, Automotive Marketing Platform sends customers personalized offers, matching them with current inventory and including personalized payment recommendations based on their equity position and applicable incentives data.
  • Marketing Account Manager: All campaigns built in Automotive Marketing Platform are backed by the support of a dedicated Marketing Account Manager, an automotive marketing specialist who guides and executes the dealership’s strategic marketing direction.
  • Dashboard/Reporting: A robust reporting dashboard enables dealerships to quickly understand the performance of campaigns and channels so impactful adjustments can be made effectively, helping to maximize ROI on marketing spend.
  • Marketing Channels: Recommendations and automated CRM tasks ensure customers are reached on the right channels, including email, phone calls, and Facebook/Instagram ads.

«One of the greatest strengths of Automotive Marketing Platform is being able to target customers with the right message, at the right time—at the right moment when the customer is most likely to act and create opportunities for our stores,» added Justin Harmon, Marketing Director, Eide Automotive Group.

The Automated Marketing Platform joins VinSolutions’ portfolio of products that leverage data science and artificial intelligence, including Connect Automotive Intelligence. In addition to providing salespeople with insights to better understand their customers, dealers will now be able to use Connect AI Buying Signals as a lead source with the new automated lead creation functionality. Connect AI and Automotive Marketing Platform can be purchased separately as well as integrate seamlessly to create even more powerful and accurate customer engagement.

To learn more about Automotive Marketing Platform powered by VinSolutions, visit www.vinsolutions.com.  

About VinSolutions 

As the provider of Connect CRM, Connect Automotive Intelligence, and the supporting suite of Connect solutions, VinSolutions helps more than 6,000 dealers make every connection count. VinSolutions’ industry-leading tools—including customizable customer relationship management, artificial intelligence, and desking—help dealerships drive more leads, increase profits, and accelerate the path to purchase. Founded in 2006 and headquartered in Mission, Kansas, VinSolutions fosters dealership success by providing a fully customizable suite of solutions, including equity mining, market pricing and desking tools, combined with the continuous, personal support of a designated Performance Manager. VinSolutions is OEM certified by every major manufacturer and is Autosoft, CDK, Reynolds & Reynolds and Dealertrack DMS certified. www.vinsolutions.com 

About Cox Automotive

Cox Automotive Inc. makes buying, selling, owning and using vehicles easier for everyone. The global company’s more than 27,000 team members and family of brands, including Autotrader®, Clutch Technologies, Dealer.com®, Dealertrack®, Kelley Blue Book®, Manheim®, NextGear Capital®, VinSolutions®, vAuto® and Xtime®, are passionate about helping millions of car shoppers, 40,000 auto dealer clients across five continents and many others throughout the automotive industry thrive for generations to come. Cox Automotive is a subsidiary of Cox Enterprises Inc., a privately-owned, Atlanta-based company with annual revenues of nearly $20 billion. www.coxautoinc.com

1 «Why Sales Reps Spend Less Than 36% of Time Selling (And Less Than 18% In CRM).» Krogue, Ken. Jan. 10, 2018


Cision View original content to download multimedia:http://www.prnewswire.com/news-releases/vinsolutions-introduces-its-automotive-marketing-platform-to-help-dealers-take-charge-of-their-campaigns-301214907.html

SOURCE VinSolutions

Black and Hispanic Americans on the U.S. financial system: «The odds were always against me,» new Credit Sesame survey finds

SAN FRANCISCO, Jan. 26, 2021 /PRNewswire/ — Black and Hispanic Americans are being hit harder by the credit system, a recent survey from Credit Sesame finds. With poor credit impacting more than just one’s financial picture—it can affect everything from a consumer’s mental health to their ability to get a car loan…

SAN FRANCISCO, Jan. 26, 2021 /PRNewswire/ — Black and Hispanic Americans are being hit harder by the credit system, a recent survey from Credit Sesame finds. With poor credit impacting more than just one’s financial picture—it can affect everything from a consumer’s mental health to their ability to get a car loan or lease a cell phone—this racial credit gap comes at a high cost.  

According to the research, which surveyed 5,000 adults in the United States, Black Americans report having the lowest overall credit scores of the groups surveyed. More than half (54 percent) of Black Americans report having poor or fair credit (a credit score below 640) or no credit at all, while 41 percent of Hispanic Americans, 37 percent of White Americans and 18 percent of Asian Americans fall into this category.

Black Americans are also at a disadvantage when it comes to financial products, savings and debt. Over half (53 percent) of Black Americans say they are living paycheck to paycheck, significantly higher than 44 percent of Americans overall, and many more Black Americans (21 percent) say they have student loans compared to the rate among all Americans (13 percent). Just 53 percent of Black Americans report having a credit card—a critical component for helping to build a strong credit foundation when used correctly—compared to 63 percent of Hispanic Americans, 67 percent of White Americans, and 79 percent of Asian Americans.

«I was never taught [about finances] growing up,» said a Black American survey respondent. «I was told investing was only what rich people could do.»

Asian Americans, in contrast, say they are thriving in the credit system. More than 80 percent of Asian Americans have a good or excellent credit score (a credit score above 640), significantly higher than the national average of 61 percent. Additionally, 92 percent of this group reported having a positive or neutral experience with their credit.

«While the credit system was created to be blind, this data shows that Black and Hispanic Americans are being unfairly shut out of the system,» said Jay Moon, General Manager of Credit at Credit Sesame. «We’ve seen that the cost of poor credit is much more than financial, impacting everything from mental health to relationships. It’s unacceptable that this is affecting the lives of some more than others.»

The credit score itself is only part of the story—many feel like they are inherently at a disadvantage within the credit system. Hispanic Americans feel nearly as slighted by the system as Black Americans. Nearly a third of Black Americans (30 percent) and a quarter of Hispanic Americans (25 percent) say they never had a chance to build good credit and that the system was stacked against them from the beginning. Further:

  • Thirty percent of Black Americans and 27 percent of Hispanic Americans say they were misinformed or tricked in their first interactions with credit, compared to 18 percent among White Americans and 15 percent among Asian Americans.
  • Twenty-one percent of Black Americans, 17 percent of Hispanic Americans and 16 percent of White Americans say financial services exist to hurt them, significantly higher than Asian Americans (9 percent).
  • Nearly 1 in 3 Black and Hispanic Americans (30 percent) say there aren’t fair credit options for people like them, significantly higher than among White Americans (26 percent) and Asian Americans (23 percent).
  • Over a third of Black Americans (34 percent) and Hispanic Americans (32 percent) are fearful and uncertain about the future because of their credit score compared to 27 percent White Americans and 20 percent Asian Americans.

One survey respondent said: «As an African American person, I feel that the odds were always against me. Banks won’t give us loans, etc.» A Hispanic American survey respondent added: «I was misinformed about credit and the way that it works. The odds were never in my favor from the beginning.»

«Creating equal credit opportunity is a critical first step toward helping to close the racial gap in our society, and it’s promising to see so many fintechs recognize this,» said Moon. «Whether it’s creating products explicitly for these underserved groups or providing more ways to access credit and resources, the important thing is to make progress.»

Methodology
Credit Sesame conducted this research using an online survey prepared by Method Research and distributed by Dynata among n=5,000 adults in the United States. The sample was balanced by census targets for age, gender and ethnicity to be nationally representative of the US population. Data was collected from October 16 to October 30, 2020. 

About Credit Sesame
Credit Sesame’s mission is to help consumers work toward financial stability and ultimately create better opportunities for themselves and their families. Strong credit health is inextricably linked to financial health and stability, and with the launch of Sesame Cash, Credit Sesame will help consumers manage both. Credit Sesame has helped millions of consumers improve their credit scores, increase their approval odds, lower the cost of credit and save money. Credit Sesame is funded by leading venture capital firms and strategic investors, including Menlo Ventures, Inventus Capital, Globespan Capital, IA Capital Groups, NortonLifeLock, Capital One Ventures, and Stanford University, among others. Credit Sesame currently operates in the U.S. and Canada. For more information on Credit Sesame, visit www.creditsesame.com and follow on Facebook, Twitter and LinkedIn.


Cision View original content to download multimedia:http://www.prnewswire.com/news-releases/black-and-hispanic-americans-on-the-us-financial-system-the-odds-were-always-against-me-new-credit-sesame-survey-finds-301215072.html

SOURCE Credit Sesame