Including an Updated Mineral Reserve and Resource Estimate and Preliminary Economic Assessment Results
TORONTO, March 1, 2021 /PRNewswire/ – Golden Star Resources Ltd. (NYSE American: GSS) (TSX: GSC) (GSE: GSR) («Golden Star» or the «Company») today filed a National Instrument 43-101 («NI 43-101») technical report («Technical Report») which includes a mineral reserve and resource update and a preliminary economic assessment («PEA») of the potential expansion of the Southern Extension zone in the Wassa underground gold mine in Ghana («Wassa Underground»). The Technical Report is available on the Company’s website and under the Company’s profile on SEDAR at www.sedar.com. All references herein to «$» are to United States dollars.
The PEA provides an assessment of the development of the Southern Extension of Wassa and the increase in mining rates to fully utilize the available process plant capacity. The PEA represents a conservative plan which excludes exploration opportunities from the scope and adopts the current mining practices and equipment to deliver a robust economic outcome while minimizing execution risk. Opportunities to improve productivity and reduce the environmental impact of the operation through the application of technology will be evaluated in the next phase of work.
MINERAL RESERVE AND RESOURCE UPDATE HIGHLIGHTS:
- Achieved 86% increase in measured mineral resource and 98% increase in proven mineral reserve at Wassa Underground demonstrates the improving geological confidence that has been delivered by recent infill drilling programs.
- Wassa expected to deliver increased value with cut-off grades optimized for the higher mining rates achieved in 2020 and the resulting unit cost reductions. The open pit resource has been remodelled as an underground resource which enables accelerated access, reduced upfront capital demand and removal of low-margin ounces from the plan.
- Measured and indicated mineral resource at Wassa Underground has increased by 1.0 million ounces («Moz») after the addition of material formerly reported as open pit and the cut-off grade reduction from 1.89 grams per tonne («g/t») to 1.4g/t.
- Total proven and probable mineral reserve has decreased by 321 thousand ounces («koz») after depletion and the conversion of the previous open pit mineral reserve. The optimized underground mineral reserve has increased by 21% to 1.1 Moz of gold.
- The mineral reserve plan outlines a six-year mine life with annual production averaging 177 koz of gold at an all-in sustaining cost («AISC») of $881 per ounce («/oz») (excluding corporate costs), for a post-tax net present value («NPV») of approximately $336 million («m»).
PEA HIGHLIGHTS:
- Life of mine («LOM») of 11-years from the inferred mineral resource in the Southern Extension zone, with total gold production of 3.5Moz. Average annual gold production of 294koz, representing an approximate 75% increase on the current production rate.
- Average cash operating costs per ounce of $551 over the LOM, average AISC (excluding corporate costs) of $778/oz over the LOM. The cost estimate is based on actual activity costs from 2020 with adjustments as the mining depth increases.
- The PEA outlines a development pathway to increase the underground mining rate to fully utilize the plant’s processing capacity with low upfront capital demand through access and haulage via twin declines.
- Robust economics with after-tax NPV5% of approximately $783m and an internal rate of return («IRR») of 53% at consensus gold price per ounce ($1,585/oz long term).
- The growth project is expected to be funded by its cash flow and available liquidity; the flexibility of the development strategy means that the investment phase can be slowed or accelerated subject to the gold price.
- Opportunities to add value to the PEA outcomes include: design optimization (level spacing, stope size); haulage systems (infrastructure, electrification); resource extension (from drilling); and emissions reduction (renewables, power and water efficiency).
- Given the strength of the prevailing gold price, the investment in drilling, development and trade-off studies will be progressed in 2021, as already outlined in the Company’s guidance for the year.
Andrew Wray, Chief Executive Officer of Golden Star, commented:
«In 2020, we focused on improving our geological confidence in the orebody through an extensive infill drilling program which has resulted in a significant increase in our measured resource and proven reserve. Converting the open pit reserve at Wassa to an underground reserve allows us to bring production from those areas forward with a lower upfront capital cost. Development of the Upper Mine will start to deliver production from 2023 and will provide a second decline access to the mine which can be incorporated into the long term mine design.
The PEA demonstrates the significant value and growth potential of Wassa, clearly laying out the path to underground mining rates in excess of 7,000tpd and production of approximately 300koz per annum when in steady state production. Following this study and with a stronger balance sheet, we are in a position to further accelerate the investment in drilling, development and exploration programs to deliver on the growth potential and value of Wassa.
With moderate conversion factors and cost estimates based on actual performance, the PEA demonstrates the potential for an after-tax NPV of $783m at the long-term consensus gold price of $1,585/oz, this being incremental to the reserve mine plan, and represents a meaningful addition to the value of Wassa.
In parallel we will be expanding our exploration efforts to add to the already impressive resource growth at Wassa, with the orebody open in almost every direction, follow up near mine open pit targets and standalone exploration targets along the 90km Wassa trend. Exploration success could further supplement the already exciting growth opportunity.»
Virtual Investor Day
The Company will conduct a conference call and webcast today, Monday, March 1, 2021 at 09.00 am ET to discuss the Technical Report, PEA results, exploration opportunities and growth strategy.
Toll Free (North America): +1 888 390 0546
Toronto Local and International: +1 416 764 8688
Toll Free (UK): 0800 652 2435
Conference ID: 07861267
Webcast: https://produceredition.webcasts.com/starthere.jsp?ei=1433535&tp_key=0dc82839cc
A replay of the webcast will be available on the Company’s website: www.gsr.com following the call.
SUMMARY OF MINERAL RESERVE & PEA MINE PLAN
Table 1 – Mineral Reserve Mine Plan Summary
|
1. See «Non-GAAP Financial Measures»
|
Unit
|
Total/Average
|
|
|
|
|
Life of mine («LOM»)
|
Years
|
6
|
|
Total LOM ore mined
|
kt
|
10,818
|
|
Mining rate (range)
|
tpd
|
4,900-5,500
|
|
Average Mined Grade
|
g/t
|
3.1
|
|
Average plant throughput (steady state)
|
kt/year
|
1,967
|
|
Feed grade (including low grade stockpiles)
|
g/t
|
2.9
|
|
Recovery (LOM average)
|
%
|
94.1%
|
|
Average annual production
|
koz
|
177
|
|
Total LOM production
|
koz
|
1,024
|
|
|
|
|
Cash operating costs1 (LOM average)
|
$/oz
|
682
|
|
AISC1 (LOM average) – excludes corporate G&A
|
$/oz
|
881
|
|
|
|
|
Total Sustaining capital
|
$m
|
137
|
|
Total Growth capital
|
$m
|
48
|
|
Closure costs
|
$m
|
14
|
|
Total Capital Costs
|
$m
|
199
|
|
|
|
|
NPV5% After tax – 100% basis (Consensus gold price)
|
$m
|
336
|
|
Annual EBITDA
|
$m
|
151
|
Table 2 –PEA Mine Plan Summary (Excludes Reserves)
|
1. See «Non-GAAP Financial Measures»
|
Unit
|
Total/Average
|
|
|
|
|
Life of mine («LOM»)
|
Years
|
11
|
|
Total LOM ore mined
|
kt
|
29,632
|
|
Mining rate (range)
|
tpd
|
6,700-7,400
|
|
Average Mined Grade
|
g/t
|
3.8
|
|
Average plant throughput (steady state)
|
kt/year
|
2,700
|
|
Feed grade (including low grade stockpiles)
|
g/t
|
3.8
|
|
Recovery (LOM average)
|
%
|
94.8
|
|
Average annual production
|
koz
|
294
|
|
Total LOM production
|
koz
|
3,456
|
|
|
|
|
Cash operating costs1 (LOM average)
|
$/oz
|
551
|
|
AISC1 (LOM average) – excludes corporate G&A
|
$/oz
|
778
|
|
|
|
|
Total Sustaining capital
|
$m
|
561
|
|
Total Growth capital
|
$m
|
229
|
|
Closure costs
|
$m
|
15
|
|
Total Capital Costs
|
$m
|
804
|
|
|
|
|
NPV5% After tax – 100% basis (Consensus long term gold price)
|
$m
|
783
|
|
After-tax IRR
|
$m
|
53%
|
|
Annual EBITDA (steady state)
|
$m
|
278
|
|
1.
|
See «Non-GAAP Financial Measures»
|
WASSA GOLD MINE OVERVIEW
Golden Star owns a 90% interest in, and manages, Golden Star (Wassa) Limited, whose primary asset is the Wassa gold mine, with the Government of Ghana owning the remaining 10%. The Wassa mine is located in the Western Region of Ghana, 150km west of the capital, Accra. Wassa lies within the southern portion of the Ashanti Greenstone Belt. The property covers an area of 5,289Ha with 595Ha of disturbance from Wassa activities. The mine has been operating since 1998 as an open pit operation and Wassa Underground commenced development in 2015 and reached commercial production in January 2017. Since 2017 Wassa Underground has shown consistent improvement in ore tonnage generation capacity.
SCOPE OF THE UPDATED TECHNICAL REPORT
The Technical Report has been prepared in accordance with the requirements of NI 43-101 and Form 43-101F1, and contains:
- Updated mineral resource and mineral reserve estimates, as at December 31, 2020.
- Summary of a PEA of the potential expansion of Wassa Underground to extract the inferred mineral resource in the Southern Extension zone.
The PEA has been prepared within the following framework:
- Underground mining rate increase to fully utilize the installed processing capacity (2.7 million tonnes per annum («Mtpa»)).
- Production schedules to appropriately consider conversion risk of the inferred mineral resource.
- Resources and exploration targets outside of the Southern Extension zone are excluded from the scope of the study.
- Methodologies and design quantities based on proven, currently available technologies.
- Costs reflect current operational experience.
- Minimize capital demand needed to establish full production.
This framework is intended to present a deliverable PEA plan which can be executed within the Company’s current operational and financial capacity. Potential enhancements outside of this framework are expected to be evaluated in the next phase of work. The PEA is preliminary in nature, is entirely based on an inferred mineral resource and there is no certainty that further geological drilling will result in the determination of higher mineral resource classification, nor that production and financial outcomes will be realized. Mineral resources that are not mineral reserves do not have demonstrated economic viability.
MINERAL RESOURCES UPDATE – EFFECTIVE DATE DECEMBER 31, 2020
Measured and Indicated Mineral Resources
The measured and indicated mineral resources at Wassa reduced by 4%, or 138koz, in 2020, while the grade increased from 2.34g/t to 3.76g/t, mainly due to:
- Depletion from mine production.
- Conversion of the open pit mineral resource for underground extraction, and application of a higher cut-off grade for the change in mining method which removed low-grade, low-margin, ounces from the estimate.
- Reduced cut-off grade from 1.89g/t to 1.4g/t, based on lower unit costs driven by increased throughput in 2020 (gold price assumption of $1,500/oz for the mineral resource has not changed).
- The measured mineral resource increased by 86%, demonstrating increased geological confidence as a result of definition drilling conducted in 2020 which was focussed on grade control drilling.
|
Measured Resource
2020
|
Measured Resource
2019
|
Change
|
|
Mt
|
g/t
|
koz
|
Mt
|
g/t
|
koz
|
% cont.Au
|
|
Wassa Open Pit
|
–
|
–
|
–
|
–
|
–
|
–
|
–
|
|
Wassa Underground
|
5.90
|
4.45
|
843
|
2.83
|
4.99
|
454
|
+86%
|
|
Father Brown/Adoikrom UG
|
–
|
–
|
–
|
–
|
–
|
–
|
–
|
|
Regional Open Pit
|
–
|
–
|
–
|
–
|
–
|
–
|
–
|
|
Total Wassa
|
5.90
|
4.45
|
843
|
2.83
|
4.99
|
454
|
+86%
|
|
Indicated Resource
2020
|
Indicated Resource
2019
|
Change
|
|
Mt
|
g/t
|
koz
|
Mt
|
g/t
|
koz
|
% cont.Au
|
|
Wassa Open Pit
|
–
|
–
|
–
|
29.18
|
1.29
|
1,206
|
-100%
|
|
Wassa Underground
|
18.96
|
3.55
|
2,162
|
13.37
|
3.66
|
1,573
|
+37%
|
|
Father Brown/Adoikrom UG
|
1.31
|
7.96
|
335
|
0.91
|
8.67
|
254
|
+32%
|
|
Regional Open Pit
|
3.10
|
1.98
|
197
|
2.51
|
2.32
|
187
|
+5%
|
|
Total Wassa
|
23.37
|
3.59
|
2,694
|
45.98
|
2.18
|
3,221
|
-16%
|
|
Measured & Indicated
Resource 2020
|
Measured & Indicated
Resource 2019
|
Change
|
|
Mt
|
g/t
|
koz
|
Mt
|
g/t
|
koz
|
% cont.Au
|
|
Wassa Open Pit
|
–
|
–
|
–
|
29.18
|
1.29
|
1,206
|
-100%
|
|
Wassa Underground
|
24.85
|
3.76
|
3,005
|
16.20
|
3.89
|
2,027
|
+48%
|
|
Father Brown/Adoikrom UG
|
1.31
|
7.96
|
335
|
0.91
|
8.67
|
254
|
+32%
|
|
Regional Open Pit
|
3.10
|
1.98
|
197
|
2.51
|
2.32
|
187
|
+5%
|
|
Total Wassa
|
29.26
|
3.76
|
3,537
|
48.81
|
2.34
|
3,675
|
-4%
|
Inferred Mineral Resources
The inferred mineral resources at Wassa increased by 9%, or 665koz, in 2020. The change was due to:
- Treatment of the previous Wassa open pit resource for underground extraction.
- Reduced cut-off grade from 1.89g/t to 1.4g/t for underground deposits and 0.62-0.89g/t to 0.55g/t for open pit deposits, based on lower unit costs driven by increased throughput in 2020 (gold price assumption for the mineral resource has not changed at $1,500/oz).
- Re-optimization of economic shells for the open pit deposits.
- Re-modelling of the Father Brown/Adoikrom underground deposit which separated the HG, HW and FW zones into different estimation domains.
|
Inferred Resource
2020
|
Inferred Resource
2019
|
Change
|
|
Mt
|
g/t
|
koz
|
Mt
|
g/t
|
koz
|
% cont.Au
|
|
Wassa Open Pit
|
–
|
–
|
–
|
0.62
|
1.31
|
26
|
-100%
|
|
Wassa Underground
|
70.50
|
3.39
|
7,689
|
58.82
|
3.75
|
7,097
|
+8%
|
|
Father Brown/Adoikrom UG
|
2.66
|
5.30
|
453
|
1.88
|
6.07
|
367
|
+23%
|
|
Regional Open Pit
|
0.87
|
1.47
|
41
|
0.42
|
2.14
|
29
|
+41%
|
|
Total Wassa
|
74.02
|
3.44
|
8,183
|
61.74
|
3.79
|
7,518
|
+9%
|
|
Notes to Mineral Resource Estimates
|
|
1.
|
The mineral resource estimate complies with the requirements of NI 43-101 and has been prepared and classified in accordance with the CIM Definition Standards for Mineral Resources and Mineral Reserves, adopted by the CIM Council on May 10, 2014, and the CIM Estimation of Mineral Resources and Mineral Reserves Best Practice Guidelines, adopted by CIM Council on November 29, 2019.
|
|
2.
|
Measured and indicated mineral resources are reported inclusive of mineral reserves.
|
|
3.
|
Underground deposits within the mineral resource are reported at a cut-off grade of 1.4g/t.
|
|
4.
|
Open pit deposits within the mineral resource are reported at a cut-off grade of 0.55g/t, within optimized pit shells calculated at a $1,500/oz gold selling price.
|
|
5.
|
The mineral resource models have been depleted using appropriate topographic surveys
|
|
6.
|
Mineral resources are reported in-situ without modifying factors.
|
|
7.
|
No open pit resource has been reported for the Wassa deposit, as engineering studies have determined Wassa will be mined by underground methods only.
|
|
8.
|
All figures are rounded to reflect the relative accuracy of the estimate.
|
|
9.
|
Mineral resources that are not mineral reserves do not have demonstrated economic viability.
|
|
10.
|
The 2020 mineral resource estimate has been prepared under supervision of S. Mitchel Wasel who is a Qualified Person («QP») as defined by NI 43-101.
|
MINERAL RESERVES SUMMARY – EFFECTIVE DATE DECEMBER 31, 2020
In 2020, the total proven and probable mineral reserves at Wassa decreased by 23%, or 321koz, whereas at Wassa Underground, proven and probable reserves increased by 9%, or 187koz. The change is mainly due to:
- Depletion by mine production of net 165koz.
- For the Upper Mine area, replacing the previously planned open pit with underground extraction, reducing the reserve by 305koz at an average implied grade of 1.21g/t.
- Reduced cut-off grade from 2.4g/t to 1.9g/t, based on lower unit costs driven by increased throughput in 2020 and assumed ore mining rate of 5,000 tonnes per day (gold price assumption for the mineral reserve has not changed at $1,300/oz).
|
Proven Mineral Reserve
2020
|
Proven Mineral Reserve
2019
|
Change
|
|
Mt
|
g/t
|
koz
|
Mt
|
g/t
|
koz
|
% cont.Au
|
|
Wassa Open Pit
|
–
|
–
|
–
|
–
|
–
|
–
|
|
|
Wassa Underground
|
4.28
|
3.28
|
451
|
1.72
|
4.11
|
228
|
+98%
|
|
Stockpiles
|
0.69
|
0.58
|
13
|
1.06
|
0.62
|
21
|
-38%
|
|
Total Wassa
|
4.97
|
2.91
|
464
|
2.79
|
2.78
|
249
|
+86%
|
|
Probable Mineral Reserve
2020
|
Probable Mineral Reserve
2019
|
Change
|
|
Mt
|
g/t
|
koz
|
Mt
|
g/t
|
koz
|
% cont.Au
|
|
Wassa Open Pit
|
–
|
–
|
–
|
9.92
|
1.57
|
500
|
-100%
|
|
Wassa Underground
|
6.54
|
2.97
|
625
|
5.70
|
3.61
|
661
|
-5%
|
|
Stockpiles
|
–
|
–
|
–
|
–
|
–
|
–
|
–
|
|
Total Wassa
|
6.54
|
2.97
|
625
|
15.62
|
2.31
|
1,160
|
-46%
|
|
Proven & Probable Mineral Reserve
2020
|
Proven & Probable Mineral Reserve
2019
|
Change
|
|
Mt
|
g/t
|
koz
|
Mt
|
g/t
|
koz
|
% cont.Au
|
|
Wassa Open Pit
|
–
|
–
|
–
|
9.92
|
1.57
|
500
|
-100%
|
|
Wassa Underground
|
10.82
|
3.09
|
1,076
|
7.42
|
3.72
|
889
|
+9%
|
|
Stockpiles
|
0.69
|
0.58
|
13
|
1.06
|
0.62
|
21
|
-38%
|
|
Total Wassa
|
11.50
|
2.94
|
1,089
|
18.41
|
2.38
|
1,410
|
-23%
|
|
Notes to the Mineral Reserve Estimate:
|
|
1.
|
The mineral reserve estimate complies with the requirements of NI 43-101 and has been prepared and classified in accordance with the CIM Definition Standards for Mineral Resources and Mineral Reserves, adopted by the CIM Council on May 10, 2014, and the CIM Estimation of Mineral Resources and Mineral Reserves Best Practice Guidelines, adopted by CIM Council on November 29, 2019.
|
|
2.
|
The mineral reserve is reported at a cut-off grade of 1.9 g/t, calculated at a $1,300 /oz gold selling price.
|
|
3.
|
Modifying factors are applied as 5.0% dilution and 96.1% recovery for stopes.
|
|
4.
|
Material based on measured mineral resources are reported as proven mineral reserves.
|
|
5.
|
Material based on indicated mineral resources are reported as probable mineral reserves.
|
|
6.
|
Material based on inferred mineral resources are excluded from mineral reserves.
|
|
7.
|
Economic analysis of the mineral reserve demonstrates economic viability at $1,300/oz gold price.
|
|
8.
|
All figures are rounded to reflect the relative accuracy of the estimate.
|
")
MINERAL RESERVE MINE PLAN
The mineral reserve mine plan includes mining and processing of ore defined by the mineral reserve only. It outlines a six-year life for Wassa Underground (2021-2026), with average annual production of 177koz at a mine site AISC of $881/oz. The plan is a continuation of the current operating strategy with no material change to the mining methodology, underground infrastructure or processing plant. The recent investment in infrastructure, such as the paste fill plant and electrical upgrades, is expected to support the increased mining rates outlined in the Mineral reserve mine plan.
Table 3 – Mineral Reserve Life of Mine Plan – Operations, Cost and Capital Summary
|
|
Total/
Average
|
2021
|
2022
|
2023
|
2024
|
2025
|
2026
|
|
|
|
|
|
|
|
|
|
|
Mining schedule
|
|
|
|
|
|
|
|
|
|
Total ore mined
|
kt
|
10,818
|
1,784
|
1,826
|
1,804
|
1,939
|
2,020
|
1,445
|
|
Mining rate (ore)
|
tpd
|
4,937
|
4,888
|
5,003
|
4,943
|
5,299
|
5,534
|
3,958
|
|
Mined Grade
|
g/t
|
3.09
|
3.08
|
3.11
|
3.29
|
3.07
|
2.94
|
3.10
|
|
Contained gold
|
koz
|
1,076
|
177
|
183
|
191
|
191
|
191
|
144
|
|
|
|
|
|
|
|
|
|
|
Processing schedule
|
|
|
|
|
|
|
|
|
|
Ore processed
|
kt
|
11,504
|
1,945
|
2,126
|
1,804
|
1,939
|
2,020
|
1,670
|
|
Feed Grade
|
g/t
|
2.94
|
2.87
|
2.75
|
3.29
|
3.07
|
2.94
|
2.76
|
|
Contained gold
|
koz
|
1,089
|
180
|
188
|
191
|
191
|
191
|
148
|
|
Recovery
|
%
|
94.1%
|
94.6%
|
94.0%
|
94.7%
|
94.1%
|
93.7%
|
93.1%
|
|
Production
|
koz
|
1,024
|
170
|
177
|
180
|
180
|
179
|
138
|
|
|
|
|
|
|
|
|
|
|
Operating costs
|
|
|
|
|
|
|
|
|
|
Mining
|
$m
|
374.0
|
70.1
|
65.5
|
66.4
|
70.5
|
60.8
|
40.7
|
|
Mining
|
$/t
|
34.57
|
39.29
|
35.89
|
36.82
|
36.35
|
30.09
|
28.15
|
|
Processing
|
$m
|
220.4
|
37.1
|
39.6
|
35.2
|
37.0
|
38.1
|
33.4
|
|
Processing
|
$/t
|
19.16
|
19.08
|
18.62
|
19.50
|
19.09
|
18.88
|
19.97
|
|
Site G&A
|
$m
|
99.9
|
16.7
|
17.1
|
16.4
|
16.7
|
16.9
|
16.1
|
|
Site G&A
|
$/t
|
9.09
|
8.99
|
8.44
|
9.54
|
9.03
|
8.76
|
10.00
|
|
Cash operating costs (exc. royalties) 1
|
$/oz
|
682
|
733
|
696
|
658
|
694
|
652
|
657
|
|
AISC (exc. corporate G&A) 1
|
$/oz
|
881
|
947
|
952
|
889
|
951
|
785
|
728
|
|
|
|
|
|
|
|
|
|
|
Capital expenditure
|
|
|
|
|
|
|
|
|
|
Sustaining capital
|
$m
|
136.5
|
25.3
|
33.9
|
29.9
|
34.5
|
12.2
|
0.8
|
|
Growth capital
|
$m
|
47.7
|
14.9
|
17.4
|
11.1
|
4.3
|
–
|
–
|
|
Closure2
|
$m
|
14.3
|
|
|
0.3
|
0.8
|
0.8
|
0.5
|
|
Total Capex
|
$m
|
198.5
|
40.2
|
51.3
|
41.3
|
39.6
|
13.0
|
1.3
|
|
1.
|
See «Non-GAAP Financial Measures»
|
|
2.
|
Closure costs of $14.3m include $11.9m that is expected to be spent beyond 2026 and therefore not shown in the table.
|
Mining Areas
The mineral reserve mine plan includes mining of:
- Panels 1 and 2: the current operating areas extracting B-shoot, F-shoot and Hanging-wall zones.
- Panel 3: Upper Mine B-Shoot and 242 areas, formerly planned for open pit extraction, that will now be mined from underground, which is expected to generate higher returns by removing low-grade low-margin material from the plan and allow for earlier access for production to support increased underground ore mining rates.
Operating Costs
Operating costs estimates are based on actual fixed and variable components of 2020 activity costs, applied against the scheduled design quantities. Average unit costs per ore tonne for the mineral reserve plan are:
- Mining: $34.6/t
- Processing: $19.2/t
- Site G&A: $9.1/t
Capital Expenditure
Capital expenditure is expected to total approximately $184m over the six-year life of the mineral reserve mine plan. Of this total, 26% is growth capital and 74% sustaining capital. The most significant component of the growth capital is the $26.6m (including $4.5m for ventilation shafts) investment in underground development to access the mining areas, $8.6m for definition drilling of the Panel 3 areas in the Upper Mine and $12m for the ventilation upgrade ($7.5m in projects plus the $4.5m in mine development referenced above), which will commence in 2021. In addition to the above capital estimates, closure costs are expected to total $14.3m.
Table 4 – Mineral Reserve Mine Plan – Capital Cost Summary
|
Units
|
Growth Capital
|
Sustaining Capital
|
Activity Total
|
|
|
|
|
|
|
Mine Development
|
$m
|
26.6
|
51.7
|
78.3
|
|
Mining UG
|
$m
|
–
|
33.2
|
33.2
|
|
Definition Drilling
|
$m
|
8.6
|
–
|
8.6
|
|
Processing
|
$m
|
–
|
5.5
|
5.5
|
|
Site G&A
|
$m
|
–
|
18.3
|
18.3
|
|
TSF
|
$m
|
–
|
9.8
|
9.8
|
|
Mobile Fleet
|
$m
|
–
|
18.2
|
18.2
|
|
Projects – Ventilation
|
$m
|
7.5
|
–
|
7.5
|
|
Projects – Other
|
$m
|
5.0
|
–
|
5.0
|
|
Total
|
$m
|
47.7
|
136.5
|
184.3
|
|
Closure costs
|
$m
|
|
|
14.3
|
|
Total (including closure costs)
|
$m
|
|
|
198.6
|
Economic Analysis
Table 5 – Mineral Reserve Mine Plan – Valuation Analysis
|
Units
|
Base case $1,300/oz
|
Consensus case Ave.$1,751/oz
|
|
|
|
|
|
Pre-Tax Valuation – 100% basis
|
|
|
|
|
Project cash flow, pre-tax
|
$m
|
255.9
|
656.4
|
|
NPV5%
|
$m
|
212.2
|
560.2
|
|
|
|
|
|
Post-Tax Valuation – 100% basis
|
|
|
|
|
Project cash flow, after-tax
|
$m
|
147.5
|
394.2
|
|
NPV5%
|
$m
|
121.2
|
335.6
|
The mineral reserve as at December 31, 2020 has been valued using a discounted cash flow analysis to calculate NPV. The base case applies the mineral reserve gold assumption price of $1,300/oz with a positive cash flow, which supports declaration of a mineral reserve.
In addition, a consensus case has been calculated by applying the average annual gold price forecasts from 27 banks and financial institutions, as at the end of January 2021. This scenario shows the project as economically robust and capable of significant cash generation, with an NPV of approximately $336m. The consensus gold price applied to each year varies as detailed in Table 6.
Table 6 – Mineral Reserve Mine Plan – Gold Price Assumptions
|
Life of mine average
|
2021
|
2022
|
2023
|
2024
|
2025
|
2026
|
|
|
|
|
|
|
|
|
|
Base case
|
1,300
|
1,300
|
1,300
|
1,300
|
1,300
|
1,300
|
1,300
|
|
Consensus case
|
1,751
|
1,944
|
1,880
|
1,773
|
1,716
|
1,585
|
1,585
|
Sensitivity Analysis
Sensitivity analyses were performed for variations in gold price, gold grade, gold recovery, operating costs, capital costs and to determine their relative importance as value drivers. Full details of the sensitivity analysis are available in the Technical Report. Included in Table 7 and 8 is a summary of the mineral reserve mine plan’s NPV sensitivity to gold price, discount rate, operating cost and capital cost assumptions.
Table 7 – Mineral Reserve Mine Plan – NPV and IRR Sensitivity Analysis
|
|
Gold Price
|
|
($m)
|
$1,200
|
Base case
$1,300
|
$1,400
|
$1,500
|
$1,600
|
$1,700
|
Consensus
$1,751 (average)
|
$1,800
|
$1,900
|
|
|
|
|
|
|
|
|
|
|
|
|
Discount Rate
|
0%
|
93
|
147
|
202
|
257
|
311
|
360
|
394
|
421
|
475
|
|
5%
|
75
|
121
|
168
|
214
|
260
|
302
|
336
|
353
|
400
|
|
7.5%
|
67
|
110
|
153
|
196
|
239
|
278
|
311
|
325
|
368
|
|
10%
|
61
|
101
|
141
|
181
|
221
|
256
|
289
|
300
|
340
|
Table 8 – Mineral Reserve Mine Plan – Operating And Capital Cost Sensitivity
|
|
Operating cost sensitivity
|
|
($m)
|
-30%
|
-20%
|
-10%
|
0%
|
10%
|
20%
|
30%
|
|
|
|
|
|
|
|
|
|
|
Capital cost sensitivity
|
-30%
|
+226
|
+167
|
+108
|
+49
|
-6
|
-65
|
-124
|
|
-20%
|
+210
|
+151
|
+92
|
+32
|
-22
|
-82
|
-141
|
|
-10%
|
+194
|
+134
|
+75
|
+16
|
-39
|
-98
|
-157
|
|
0%
|
+177
|
+118
|
+59
|
|
-55
|
-114
|
-173
|
|
10%
|
+161
|
+102
|
+43
|
-16
|
-71
|
-130
|
-189
|
|
20%
|
+145
|
+86
|
+27
|
-32
|
-87
|
-146
|
-206
|
|
30%
|
+129
|
+70
|
+10
|
-49
|
-104
|
-163
|
-222
|
Opportunities
Several opportunities have been identified with potential to add value to the mineral reserve mine plan:
- Mineral Resource. Upside potential exists to upgrade the large inferred mineral resource and to grow the defined mineralization on targets, which are not yet tested. The Company has a track record of increasing the underground mineral reserve (net of depletion) through resource-reserve conversion, as demonstrated in figure 3.
- Productivity and Mine Design. Improved mining practices through application of technology, geotechnical design optimization and improvements to the paste backfill system once it is established.
- Sustainability. Emissions reduction through electrification of diesel equipment and future use of renewable generation; improved water quality and efficiency; and comminution optimization to improve energy efficiency.
PRELIMINARY ECONOMIC ASSESMENT OF the southern extension zone
The PEA mine plan includes mining and processing of the inferred mineral resource. The PEA is preliminary in nature and there is no certainty that further geological drilling will result in the determination of higher mineral resource classification, nor that the production and financial outcomes outlined in the PEA mine plan will be realized. Mineral resources that are not mineral reserves do not have demonstrated economic viability. The PEA mine plan outlines an 11-year life, with average annual production of 294koz at an AISC of $780/oz.
The PEA represents a scoping level study within the following work streams:
- Mining method selection
- Stope optimization
- Mine design to determine development quantities which inform the cost estimate
- Ventilation design and modelling
- Simulation of truck haulage to validate production rate forecasts
- Definition drilling strategy
- Preliminary scheduling
- Review of metallurgical test work and processing capacity
- Review of permitting requirements
- Estimation of capital and operating costs
- Economic analysis
The scope of the PEA is to outline an underground mining method, together with supporting infrastructure and sustainability plans, to extract the potentially economic portion of the Wassa Gold Mine inferred mineral resource. The mine plan considers a production rate which targets the processing capacity, at or close to 2.7Mtpa run-of-mine material, after a five year ramp up period. The mining plan applies proven methods and available technology to create a PEA which is considered deliverable and representative of future costs.
The Wassa Mine Southern Extension project is a brownfield growth project that can be brought into production within permitting of the existing operation and through utilizing existing infrastructure (surface and underground access, processing, utilities and mine services):
- Access via sealed public road to within 15 km from site.
- Electrical infrastructure with access to power through the grid and captive on-site generation.
- Existing processing plant with permitted capacity up to 2.7 Mtpa, currently under-utilized.
- Paste Plant infrastructure.
- On-site tailings storage facilities with sufficient permitted capacity.
- Waste rock storage facilities with sufficient permitted capacity.
- Access to skilled labour given the history and scale of the gold mining industry in Ghana.
- Use mining infrastructure which exists or will be in place at completion of extracting the mineral reserve including ventilation airways and equipment, access ramps, dewatering systems and services (power, air and water).
Conversion of Mineral Resource to PEA Mining Inventory
The PEA mine plan considers only the inferred mineral resource south of 19,240mN. Conversion risk of the inferred mineral resource has been addressed through the application of cut-off grades and modifying factors in mining Panels 4-8, which form the basis of the PEA mine plan. In Panels 4 and 5 where there is more definition drilling, 54% of the metal is included in the PEA inventory. This conversion factor decreases to a more conservative 48% for the deeper panels (Panels 7 and 8) where drilling is more widely spaced.
Table 9 – Conversion of Mineral Resource to PEA Mining Inventory for Mining Panels 4-8
|
Unit
|
Panel 4
|
Panel 5
|
Panel 6
|
Panel 7
|
Panel 8
|
Total
|
|
|
|
|
|
|
|
|
|
Inferred Mineral Resource (in-situ)
|
Mt
|
7.8
|
11.5
|
8.6
|
19.6
|
18.6
|
66
|
|
Au g/t
|
3.0
|
3.1
|
2.7
|
4.0
|
3.6
|
3.4
|
|
Moz
|
0.76
|
1.14
|
0.74
|
2.52
|
2.14
|
7.3
|
|
PEA Mining Inventory
|
Mt
|
4.1
|
5.5
|
3.1
|
9.4
|
7.8
|
30
|
|
Au g/t
|
3.3
|
3.5
|
3.7
|
4.3
|
3.8
|
3.8
|
|
Moz
|
0.42
|
0.61
|
0.37
|
1.31
|
0.94
|
3.6
|
|
Conversion to PEA Inventory
|
%Moz
|
54%
|
49%
|
48%
|
50%
|
|
Cut-off Grade
|
g/t
|
2.3g/t
|
2.9g/t
|
|
|
Modifying factors
|
|
7.5% Dilution
|
13% Dilution
|
|
|
95% Ore Recovery
|
75% Recovery
|
|
Table 10 – PEA Life of Mine Plan – Operating Summary
|
1. See «Non-GAAP
Financial Measures»
|
|
Total/
Average
|
Year
1
|
Year
2
|
Year
3
|
Year
4
|
Year
5
|
Year
6
|
Year
7
|
Year
8
|
Year
9
|
Year 10
|
Year 11
|
Year 12
|
Year 13
|
Year 14
|
Year 15
|
Year 16
|
Year 17
|
|
|
|
|
|
|
|
|
|
|
|
|
|
|
|
|
|
|
|
|
|
Mining schedule
|
|
|
|
|
|
|
|
|
|
|
|
|
|
|
|
|
|
|
|
|
Total ore mined
|
kt
|
29,632
|
–
|
14
|
53
|
108
|
748
|
1,282
|
2,700
|
2,700
|
2,700
|
2,700
|
2,675
|
2,634
|
2,644
|
2,507
|
2,445
|
2,518
|
1,203
|
|
Mining rate (ore)
|
tpd
|
6,826
|
–
|
39
|
145
|
296
|
2,049
|
3,512
|
7,397
|
7,377
|
7,397
|
7,397
|
7,330
|
7,195
|
7,245
|
6,868
|
6,699
|
6,880
|
3,295
|
|
Mined Grade
|
g/t
|
3.83
|
–
|
3.30
|
3.30
|
3.13
|
3.23
|
3.48
|
3.49
|
3.59
|
3.51
|
3.50
|
4.46
|
4.22
|
3.83
|
3.84
|
4.36
|
3.86
|
3.88
|
|
Contained gold
|
koz
|
3,644
|
–
|
2
|
6
|
11
|
78
|
143
|
303
|
311
|
305
|
304
|
383
|
357
|
326
|
310
|
343
|
313
|
150
|
|
|
|
|
|
|
|
|
|
|
|
|
|
|
|
|
|
|
|
|
|
Processing schedule
|
|
|
|
|
|
|
|
|
|
|
|
|
|
|
|
|
|
|
|
|
Ore processed
|
kt
|
29,632
|
–
|
14
|
53
|
108
|
748
|
1,282
|
2,700
|
2,700
|
2,700
|
2,700
|
2,675
|
2,634
|
2,644
|
2,507
|
2,445
|
2,518
|
1,203
|
|
Feed Grade
|
g/t
|
3.83
|
–
|
3.30
|
3.30
|
3.13
|
3.23
|
3.48
|
3.49
|
3.59
|
3.51
|
3.50
|
4.46
|
4.22
|
3.83
|
3.84
|
4.36
|
3.86
|
3.88
|
|
Contained gold
|
koz
|
3,644
|
–
|
2
|
6
|
11
|
78
|
143
|
303
|
311
|
305
|
304
|
383
|
357
|
326
|
310
|
343
|
313
|
150
|
|
Recovery
|
%
|
94.8%
|
–
|
95.0%
|
94.7%
|
94.2%
|
94.3%
|
95.4%
|
94.6%
|
94.7%
|
94.6%
|
94.6%
|
95.0%
|
95.0%
|
95.0%
|
95.0%
|
95.0%
|
95.0%
|
94.3%
|
|
Production
|
koz
|
3,456
|
–
|
1
|
5
|
10
|
73
|
137
|
287
|
295
|
289
|
287
|
364
|
340
|
309
|
294
|
326
|
297
|
142
|
|
|
|
|
|
|
|
|
|
|
|
|
|
|
|
|
|
|
|
|
|
Operating costs
|
|
|
|
|
|
|
|
|
|
|
|
|
|
|
|
|
|
|
|
|
Mining
|
$m
|
1,165.6
|
–
|
0.3
|
1.9
|
5.9
|
24.6
|
48.4
|
95.8
|
99.2
|
102.4
|
101.5
|
107.1
|
110.1
|
109.3
|
100.6
|
98.2
|
98.2
|
62.2
|
|
Mining
|
$/t
|
39.34
|
–
|
20.57
|
35.96
|
54.38
|
32.91
|
37.76
|
35.49
|
36.73
|
37.92
|
37.57
|
40.03
|
41.82
|
41.33
|
40.12
|
40.15
|
39.00
|
51.70
|
|
Processing
|
$m
|
520.8
|
–
|
0.2
|
0.7
|
1.5
|
10.2
|
14.4
|
47.4
|
47.4
|
47.4
|
47.4
|
47.1
|
46.5
|
46.7
|
44.8
|
44.0
|
44.9
|
30.0
|
|
Processing
|
$/t
|
17.58
|
–
|
13.67
|
13.67
|
13.67
|
13.67
|
11.27
|
17.57
|
17.57
|
17.57
|
17.57
|
17.60
|
17.66
|
17.65
|
17.87
|
17.97
|
17.85
|
24.98
|
|
Site G&A
|
$m
|
203.1
|
–
|
0.0
|
0.1
|
0.3
|
1.7
|
2.5
|
18.5
|
18.5
|
18.5
|
18.5
|
18.4
|
18.3
|
18.4
|
18.0
|
17.9
|
18.1
|
15.5
|
|
Site G&A
|
$/t
|
7.38
|
–
|
2.78
|
2.78
|
2.76
|
2.77
|
2.38
|
7.32
|
7.34
|
7.33
|
7.32
|
7.50
|
7.54
|
7.47
|
7.72
|
7.91
|
7.70
|
13.45
|
|
Cash operating costs1
|
$/oz
|
551
|
–
|
367
|
520
|
746
|
504
|
482
|
568
|
564
|
588
|
588
|
479
|
520
|
568
|
560
|
496
|
547
|
765
|
|
AISC (excluding Corporate
G&A)1
|
$/oz
|
778
|
–
|
432
|
585
|
811
|
569
|
655
|
860
|
849
|
882
|
882
|
715
|
765
|
810
|
733
|
655
|
718
|
909
|
|
|
|
|
|
|
|
|
|
|
|
|
|
|
|
|
|
|
|
|
|
Capital expenditure
|
|
|
|
|
|
|
|
|
|
|
|
|
|
|
|
|
|
|
|
|
Sustaining capital
|
$m
|
560.7
|
–
|
–
|
–
|
–
|
–
|
15.1
|
65.1
|
64.9
|
66.2
|
65.8
|
62.5
|
61.2
|
54.9
|
31.7
|
30.9
|
31.6
|
11.0
|
|
Growth capital
|
$m
|
228.8
|
4.9
|
12.9
|
25.2
|
37.1
|
73.5
|
64.4
|
–
|
10.0
|
–
|
0.8
|
–
|
–
|
–
|
–
|
–
|
–
|
–
|
|
Closure costs
|
$m
|
14.6
|
|
|
|
|
|
|
|
|
|
|
|
|
|
|
|
|
2.2
|
|
Total Capex
|
$m
|
804.1
|
4.9
|
12.9
|
25.2
|
37.1
|
73.5
|
79.5
|
65.1
|
74.9
|
66.2
|
66.6
|
62.5
|
61.2
|
54.9
|
31.7
|
30.9
|
31.6
|
13.2
|
|
1.
|
See «Non-GAAP Financial Measures»
|
Mining
Mining is by underground trackless decline access (1:7 gradient). Access will be from duplicate access ramps and independent ventilation infrastructure on each side of the deposit which will support the increased mining rate and provide efficient access across the large mineralized footprint (c.850 m along c.300 m across strike). Truck haulage will utilize the dual access ramps.
The mining method proposed is bottom-up long hole open stoping (LHOS) with 25 level spacing and nominal stope sizes of 25mL x 30mW x 25-100mH with cemented paste backfill. Stopes will be mined in a primary-secondary sequence down to c.1,000m depth, transitioning to pillarless retreat below that point to account for increasing in-situ stress which will need to be further investigated in future work.
Processing
The PEA plan proposes to utilize the full capacity of the existing processing plant, with underground mine production increasing to 2.7Mtpa/7,400tpd. The plant has previously operated at these rates.
The PEA assumes average recovery of 94.8%, which is supported by current plant performance and metallurgical test work on a small number of samples that suggests processing performance for the Southern Extension feed will be similar to material currently treated. This will be evaluated in the next phase of work.
PERMITTING, ENVIRONMENTAL, AND SOCIAL AND COMMUNITY IMPACT
All required environmental and social regulatory requirements to support the PEA mine plan are in place and maintained in good standing. The Company complies with international requirements on environmental and conservation, human rights, and anti-corruption. It has adopted voluntary international codes on corporate responsibility in the areas of cyanide management, TSF design, responsible gold mining and resettlement. The Wassa Mine has posted and periodically updates its reclamation bond ($13.7m at end of 2020) as part of its licence obligations. For environmental impacts, appropriate studies and surveys have been completed, design features and management practices are established and monitoring programmes are in place for:
- Water quality
- Air quality
- Noise and vibration
- Biodiversity
Golden Star also supports several community and social initiatives via:
- The Golden Star Development Foundation (community and social development projects).
- The Golden Star Oil Palm Plantations (agribusiness sponsored by Golden Star which aims to become self- supporting).
- Capacity building and livelihood enhancement (skills training, local procurement).
These initiatives proactively aim to build capacity and diversify the economy of local communities as well as reduce uptake of small-scale illegal mining.
Operating Costs
The operating cost estimation methodology is consistent with the approach taken for the mineral reserve mine plan. Lower unit costs are expected to result from the fixed and variable costs being applied over increased annual production in the PEA mine plan. Haulage cost increases in the development and operating costs have been factored into the estimates, given the significant increase in haulage distances as mining depth increases. Average unit costs per ore tonne for the mineral reserve plan are:
- Mining: $39.33/t
- Processing: $17.58/
- Site G&A: $7.38/t
Capital Expenditure
Capital expenditure is expected to total approximately $790m over the life of the PEA mine plan. Of this total, 29% is growth capital and 71% is sustaining capital. The most significant component of the growth capital is the $98.3m investment in underground development to access the mining areas, approximately $46m for definition drilling of Panels 4-8 of the mine and $35m for the ventilation upgrades. In addition to the above capital estimates, closure costs are expected to total $14.6m.
There are no significant investments required in the process plant infrastructure as the mill and associated infrastructure have already been established with adequate capacity. The majority of the proposed capital expenditure is contained in underground lateral and vertical development mining. The PEA mining method relies on paste fill; the paste fill plant was constructed in 2020 and commissioning is expected to be finalized in Q1 2021. Capital has been allowed for an expansion of the paste fill system in the PEA mine plan.
Table 11 – PEA Mine Plan – Capital Cost Summary
|
Units
|
Growth Capital
|
Sustaining Capital
|
Activity Total
|
|
|
|
|
|
|
Mine Development
|
$m
|
98.3
|
261.8
|
360.1
|
|
Mining UG
|
$m
|
11.2
|
84.9
|
96.2
|
|
Definition Drilling
|
$m
|
45.7
|
60.4
|
106.0
|
|
Processing
|
$m
|
1.2
|
12.7
|
13.8
|
|
Site G&A
|
$m
|
3.2
|
39.3
|
42.5
|
|
TSF
|
$m
|
6.8
|
23.0
|
29.8
|
|
Mobile Fleet
|
$m
|
17.6
|
78.7
|
40.6
|
|
Projects – Ventilation
|
$m
|
35.0
|
–
|
35.0
|
|
Projects – Other
|
$m
|
9.9
|
–
|
9.9
|
|
Total
|
$m
|
228.8
|
560.7
|
789.5
|
|
Closure costs
|
$m
|
|
|
14.6
|
|
Total (including closure costs)
|
$m
|
|
|
804.1
|
Economic Analysis
Table 12 – PEA Mine Plan – Valuation Analysis
|
Units
|
Base case $1,300/oz
|
Consensus case Ave.$1,751/oz
|
|
|
|
|
|
Pre-Tax Valuation – 100% basis
|
|
|
|
|
Project cash flow, pre-tax
|
$m
|
1,379.4
|
2,274.7
|
|
NPV5%
|
$m
|
748.1
|
1,268.8
|
|
IRR
|
%
|
47%
|
66%
|
|
Payback period
|
Years
|
|
–
|
|
|
|
|
|
Post-Tax Valuation – 100% basis
|
|
|
|
|
Project cash flow, after-tax
|
$m
|
852.1
|
1,421.0
|
|
NPV5%
|
$m
|
452.2
|
783.5
|
|
IRR
|
%
|
37%
|
53%
|
|
Payback period
|
Years
|
–
|
–
|
The PEA mine plan has been valued using a discounted cash flow analysis to determine an NPV. The base case gold price scenario of $1,300/oz shows positive cash flow and indicates potential for the Southern Extension project of being economically viable and worthy of follow-up work.
The consensus case differs from the assumptions made for the mineral reserve mine plan, in that the short-term forecasts are not applied, and the scenario applies a flat $1,585/oz gold price assumption based on the average long term gold price forecasts from 27 banks and financial institutions, as at the end of January 2021. This scenario identifies an approximate $783m NPV for the project and a 53% post-tax IRR.
Table 13 – Gold Price Assumptions
|
Flat Long Term Gold Price Assumption $
|
|
|
|
Base case
|
1,300
|
|
Consensus case
|
1,585
|
Sensitivity Analysis
Sensitivity analyses were performed for variations in gold price, gold grade, gold recovery, operating costs, capital costs and to determine their relative importance as value drivers. Full detail of the sensitivity analysis is available in the Technical Report. Set out in Table 14 is a summary of the PEA mine plan’s NPV sensitivity to gold price, discount rate, operating cost and capital cost assumptions.
Table 14 – PEA Mine Plan – NPV and IRR Sensitivity Analysis
|
|
Gold Price
|
|
($m)
|
$1,200
|
Base case
$1,300
|
$1,400
|
$1,500
|
Consensus
$1,585
|
$1,600
|
$1,700
|
$1,800
|
$1,900
|
|
|
|
|
|
|
|
|
|
|
|
|
Discount Rate
|
0%
|
653
|
852
|
1,052
|
1,252
|
1,421
|
1,452
|
1,629
|
1,807
|
1,985
|
|
5%
|
336
|
452
|
568
|
685
|
783
|
801
|
905
|
1,008
|
1,111
|
|
7.5%
|
242
|
332
|
423
|
513
|
590
|
604
|
684
|
764
|
845
|
|
10%
|
174
|
245
|
316
|
388
|
448
|
459
|
522
|
585
|
648
|
|
IRR (%)
|
31.1
|
36.8
|
41.6
|
45.6
|
48.7
|
49.2
|
49.2
|
54.7
|
56.9
|
Table 15 – PEA Mine Plan – Operating and Capital Cost Sensitivity
|
|
Operating cost sensitivity
|
|
($m)
|
-30%
|
-20%
|
-10%
|
0%
|
10%
|
20%
|
30%
|
|
|
|
|
|
|
|
|
|
|
Capital cost sensitivity
|
-30%
|
+483
|
+374
|
+264
|
+155
|
+45
|
-64
|
-174
|
|
-20%
|
+432
|
+322
|
+213
|
+103
|
-6
|
-116
|
-225
|
|
-10%
|
+380
|
+271
|
+161
|
+52
|
-58
|
-168
|
-277
|
|
0%
|
+329
|
+219
|
+110
|
|
-110
|
-219
|
-329
|
|
10%
|
+277
|
+168
|
+58
|
-52
|
-161
|
-271
|
-380
|
|
20%
|
+225
|
+116
|
+6
|
-103
|
-213
|
-322
|
-432
|
|
30%
|
+174
|
+64
|
-45
|
-155
|
-264
|
-374
|
-483
|
Opportunities
Several opportunities have been identified with potential to add value to the PEA mine plan and the Southern Extension zone:
- Mineral Resource. Definition drilling to upgrade the large inferred mineral resource will allow application of lower/more conservative modifying factors, plus potentially extend the Wassa Underground mineral resource, which is open in multiple directions. In addition, there is the opportunity for exploration of identified near-mine targets.
- Productivity and Mine Design. Stope size and level intervals are consistent with current operations and may be increased as studies progress, which would reduce development quantities and cost. Haulage optimization studies and emerging electrification technology may confirm an alternative to the planned diesel truck system, which would result in reduced costs (mostly ventilation) and emissions.
- Sustainability. The same sustainability opportunities for the mineral reserve exist for the PEA but on a larger scale, with the longer mine life potential to support investment in electrification, infrastructure, efficiency projects and potential application of renewable energy sources.
Future Work Plan
The PEA proposes a progressive development plan for the Southern Extension zone, with three major phases of definition drilling and capital investment:
- Panels 4 and 5: resource development drilling and studies in Years («Y») 1-2, to inform an investment decision at the end of Y2 and full stope production in Y6.
- Panels 6 and 7: resource development drilling in Y6-7, development starting Y6 and stoping in Y8.
- Panel 8: resource development drilling in Y10, development starting Y10 and stoping in Y12.
The PEA project execution plan proposes that the definition drilling of Panels 4 and 5, technical and trade-off studies required will be completed to inform a feasibility study by the end of Y2.
Golden Star is targeting early 2023 for the completion of a feasibility study to support a new technical report as part of the annual resource and reserve update at that time. To meet this target, Golden Star has included the definition drilling and studies proposed for Y1 in the 2021 budget and definition drilling has commenced in Q1 2021 from the 570-DDD.
Technical studies are planned to investigate the value adding opportunities identified in the PEA, which will potentially enhance the project outcomes when the feasibility study is completed.
In addition, exploration drilling programs are underway to test the in-mine extensions and near-mine targets with the aim of increasing the defined resource.
Company Profile:
Golden Star Resources Ltd. («Golden Star») is an established gold mining company that owns and operates the Wassa underground mine in Ghana, West Africa. Listed on the NYSE American, the Toronto Stock Exchange and the Ghanaian Stock Exchange, Golden Star is focused on delivering strong margins and free cash flow from the Wassa mine. As the winner of the Prospectors & Developers Association of Canada 2018 Environmental and Social Responsibility Award, Golden Star remains committed to leaving a positive and sustainable legacy in its areas of operation.
Statements Regarding Forward-Looking Information
Some statements contained in this news release are «forward-looking statements» within the meaning of the Private Securities Litigation Reform Act of 1995 and «forward looking information» within the meaning of Canadian securities laws. Forward looking statements and information include but are not limited to, statements and information regarding: estimated post-tax internal rate of return and net present value of the Mineral Reserve mine plan and with respect to the PEA mine plan; the timing for production from Wassa mineral reserve mine plan and from the PEA mine plan; the life of mine for Wassa based on the mineral reserve mine plan; the life of mine based on the PEA mine plan; estimates of capital costs, and the allocation among growth capital and sustaining capital, for the Wassa mineral reserve mine plan and the PEA mine plan; estimates of remediation costs; Wassa’s ability to deliver increased value with cut-off grades optimized for the higher mining rates achieved in 2020 and the resulting unit cost reductions; the PEA’s development pathway to increase the underground mining rate to fully utilize the plant’s processing capacity; estimates of production, AISC and cash operating costs; estimates of consensus gold price; the Company’s ability to add value to the mineral reserve mine plan; the Company’s ability to realize on opportunities to add value to the PEA mine plan; and the future work plan with respect to the PEA. Generally, forward-looking information and statements can be identified by the use of forward-looking terminology such as «plans», «expects», «is expected», «budget», «scheduled», «estimates», «forecasts», «intends», «anticipates», «believes» or variations of such words and phrases (including negative or grammatical variations) or statements that certain actions, events or results «may», «could», «would», «might» or «will be taken», «occur» or «be achieved» or the negative connotation thereof. Investors are cautioned that forward-looking statements and information are inherently uncertain and involve risks, assumptions and uncertainties that could cause actual facts to differ materially. Such statements and information are based on numerous assumptions regarding present and future business strategies and the environment in which Golden Star will operate in the future. Forward-looking information and statements are subject to known and unknown risks, uncertainties and other important factors that may cause the actual results, performance or achievements of Golden Star to be materially different from those expressed or implied by such forward-looking information and statements, including but not limited to: gold price volatility; discrepancies between actual and estimated production; mineral reserves and resources and metallurgical recoveries; mining operational and development risks; liquidity risks; suppliers suspending or denying delivery of products or services; regulatory restrictions (including environmental regulatory restrictions and liability); actions by governmental authorities; the speculative nature of gold exploration; ore type; the global economic climate; share price volatility; the availability of capital on reasonable terms or at all; risks related to international operations, including economic and political instability in foreign jurisdictions in which Golden Star operates; risks related to current global financial conditions; actual results of current exploration activities; environmental risks; future prices of gold; possible variations in mineral reserves and mineral resources, grade or recovery rates; mine development and operating risks; an inability to obtain power for operations on favourable terms or at all; mining plant or equipment breakdowns or failures; an inability to obtain products or services for operations or mine development from vendors and suppliers on reasonable terms, including pricing, or at all; public health pandemics such as COVID-19, including risks associated with reliance on suppliers, the cost, scheduling and timing of gold shipments, uncertainties relating to its ultimate spread, severity and duration, and related adverse effects on the global economy and financial markets; accidents, labor disputes and other risks of the mining industry; delays in obtaining governmental approvals or financing or in the completion of development or construction activities; litigation risks; and risks related to indebtedness and the service of such indebtedness. Although Golden Star has attempted to identify important factors that could cause actual results to differ materially from those contained in forward-looking information and statements, there may be other factors that cause results not to be as anticipated, estimated or intended. There can be no assurance that future developments affecting the Company will be those anticipated by management. Please refer to the discussion of these and other factors in management’s discussion and analysis of financial conditions and results of operations for the year ended December 31, 2020, and in our annual information form for the year ended December 31, 2019 as filed on SEDAR at www.sedar.com. The forecasts contained in this press release constitute management’s current estimates, as of the date of this press release, with respect to the matters covered thereby. We expect that these estimates will change as new information is received. While we may elect to update these estimates at any time, we do not undertake any estimate at any particular time or in response to any particular event.
Non-GAAP Financial Measures
In this press release, we use the terms «cash operating cost», «cash operating cost per ounce», «all-in sustaining costs», and «all-in sustaining costs per ounce».
«Cost of sales excluding depreciation and amortization» as found in the statements of operations includes all mine-site operating costs, including the costs of mining, ore processing, maintenance, work-in-process inventory changes, mine-site overhead as well as production taxes, royalties, severance charges and by-product credits, but excludes exploration costs, property holding costs, corporate office general and administrative expenses, foreign currency gains and losses, gains and losses on asset sales, interest expense, gains and losses on derivatives, gains and losses on investments and income tax expense/benefit.
«Cost of sales per ounce» is equal to cost of sales excluding depreciation and amortization for the period plus depreciation and amortization for the period divided by the number of ounces of gold sold (excluding pre-commercial production ounces sold) during the period.
«Cash operating cost» for a period is equal to «cost of sales excluding depreciation and amortization» for the period less royalties, the cash component of metals inventory net realizable value adjustments, materials and supplies write-off and severance charges, and «cash operating cost per ounce» is that amount divided by the number of ounces of gold sold (excluding pre-commercial production ounces sold) during the period. We use cash operating cost per ounce as a key operating metric. We monitor this measure monthly, comparing each month’s values to prior periods’ values to detect trends that may indicate increases or decreases in operating efficiencies. We provide this measure to investors to allow them to also monitor operational efficiencies of the Company’s mines. We calculate this measure for both individual operating units and on a consolidated basis. Since cash operating costs do not incorporate revenues, changes in working capital or non-operating cash costs, they are not necessarily indicative of operating profit or cash flow from operations as determined under IFRS. Changes in numerous factors including, but not limited to, mining rates, milling rates, ore grade, gold recovery, costs of labor, consumables and mine site general and administrative activities can cause these measures to increase or decrease. We believe that these measures are similar to the measures of other gold mining companies, but may not be comparable to similarly titled measures in every instance.
«All-in sustaining costs» commences with cash operating costs and then adds the cash component of metals inventory net realizable value adjustments, royalties, sustaining capital expenditures, corporate general and administrative costs (excluding share-based compensation expenses and severance charges), and accretion of rehabilitation provision. For mine site all-in sustaining costs, corporate general and administrative costs (excluding share-based compensation expenses and severance charges) are allocated based on gold sold by each operation. «All-in sustaining costs per ounce» is that amount divided by the number of ounces of gold sold (excluding pre-commercial production ounces sold) during the period. This measure seeks to represent the total costs of producing gold from current operations, and therefore it does not include capital expenditures attributable to projects or mine expansions, exploration and evaluation costs attributable to growth projects, income tax payments, interest costs or dividend payments. Consequently, this measure is not representative of all of the Company’s cash expenditures. In addition, the calculation of all-in sustaining costs does not include depreciation expense as it does not reflect the impact of expenditures incurred in prior periods. Therefore, it is not indicative of the Company’s overall profitability. Share-based compensation expenses are also excluded from the calculation of all-in sustaining costs as the Company believes that such expenses may not be representative of the actual payout on equity and liability based awards.
The Company believes that «all-in sustaining costs» will better meet the needs of analysts, investors and other stakeholders of the Company in understanding the costs associated with producing gold, understanding the economics of gold mining, assessing the operating performance and the Company’s ability to generate free cash flow from current operations and to generate free cash flow on an overall Company basis. Due to the capital intensive nature of the industry and the long useful lives over which these items are depreciated, there can be a disconnect between net earnings calculated in accordance with IFRS and the amount of free cash flow that is being generated by a mine. In the current market environment for gold mining equities, many investors and analysts are more focused on the ability of gold mining companies to generate free cash flow from current operations, and consequently the Company believes these measures are useful non-IFRS operating metrics («non-GAAP measures») and supplement the IFRS disclosures made by the Company. These measures are not representative of all of Golden Star’s cash expenditures as they do not include income tax payments or interest costs. Non-GAAP measures are intended to provide additional information only and do not have standardized definitions under IFRS and should not be considered in isolation or as a substitute for measures of performance prepared in accordance with IFRS. These measures are not necessarily indicative of operating profit or cash flow from operations as determined under IFRS.
For additional information regarding the Non-GAAP financial measures used by the Company, please refer to the heading «Non-GAAP Financial Measures» in the Company’s Management Discussion and Analysis of Financial Condition and Results of Operations for the year ended December 31, 2020, which is available at www.sedar.com.
Technical Information
The mineral reserve and mineral resource estimates have been compiled by the Company’s technical personnel in accordance with definitions and guidelines set out in the Definition Standards for Mineral Resources and Mineral Reserves adopted by the Canadian Institute of Mining, Metallurgy, and Petroleum and as required by Canada’s NI 43-101. All mineral resources are reported inclusive of mineral reserves. Mineral resources which are not mineral reserves do not have demonstrated economic viability. Mineral reserve estimates reflect the Company’s reasonable expectation that all necessary permits and approvals will be obtained and maintained. Mining dilution and mining recovery vary by deposit and have been applied in estimating the mineral reserves.
The mineral resource technical contents of this press release have been reviewed and approved by S. Mitchel Wasel, BSc Geology, a «Qualified Person» pursuant to NI 43-101. Mr. Wasel is Vice President Exploration for Golden Star and an active member of the Australasian Institute of Mining and Metallurgy. The 2020 and 2019 estimates of mineral resources were prepared under the supervision of Mr. Wasel. The mineral reserve technical contents of this press release, have been reviewed and approved by and were prepared under the supervision of Matt Varvari, Vice President, Technical Services for the Company. Mr. Varvari is a «Qualified Person» as defined by NI 43-101.
Additional scientific and technical information relating to the mineral property referenced in this news release are contained in the following current technical report for the property available at www.sedar.com: «NI 43-101 Technical Report on the Wassa Gold Mine, Mineral Resource & Mineral Reserve Update and Preliminary Economic Assessment of the Southern Extension Zone, Western Region, Ghana» effective December 31, 2020.
Cautionary Note to US Investors Concerning Estimates of Measured and Indicated Mineral Resources
This press release uses the terms «measured mineral resources» and «indicated mineral resources». The Company advises US investors that while these terms are recognized and required by NI 43-101, the US Securities and Exchange Commission («SEC») does not recognize them. Also, disclosure of contained ounces is permitted under Canadian regulations; however the SEC generally requires mineral resource information to be reported as in-place tonnage and grade. US Investors are cautioned not to assume that any part or all of the mineral deposits in these categories will ever be converted into mineral reserves.
Cautionary Note to US Investors Concerning Estimates of Inferred Mineral Resources
This press release uses the term «inferred mineral resources». The Company advises US investors that while this term is recognized and required by NI 43-101, the SEC does not recognize it. «Inferred mineral resources» have a great amount of uncertainty as to their existence, and great uncertainty as to their economic and legal feasibility. It cannot be assumed that all or any part of Inferred Mineral Resources will ever be upgraded to a higher category. In accordance with Canadian rules, estimates of inferred mineral resources cannot form the basis of feasibility or other economic studies. US investors are cautioned not to assume that any part or all of the inferred mineral resource exists, or is economically or legally mineable.
 View original content to download multimedia:http://www.prnewswire.com/news-releases/golden-star-resources-files-wassa-gold-mine-ni-43-101-technical-report-301237202.html
SOURCE Golden Star Resources Ltd.

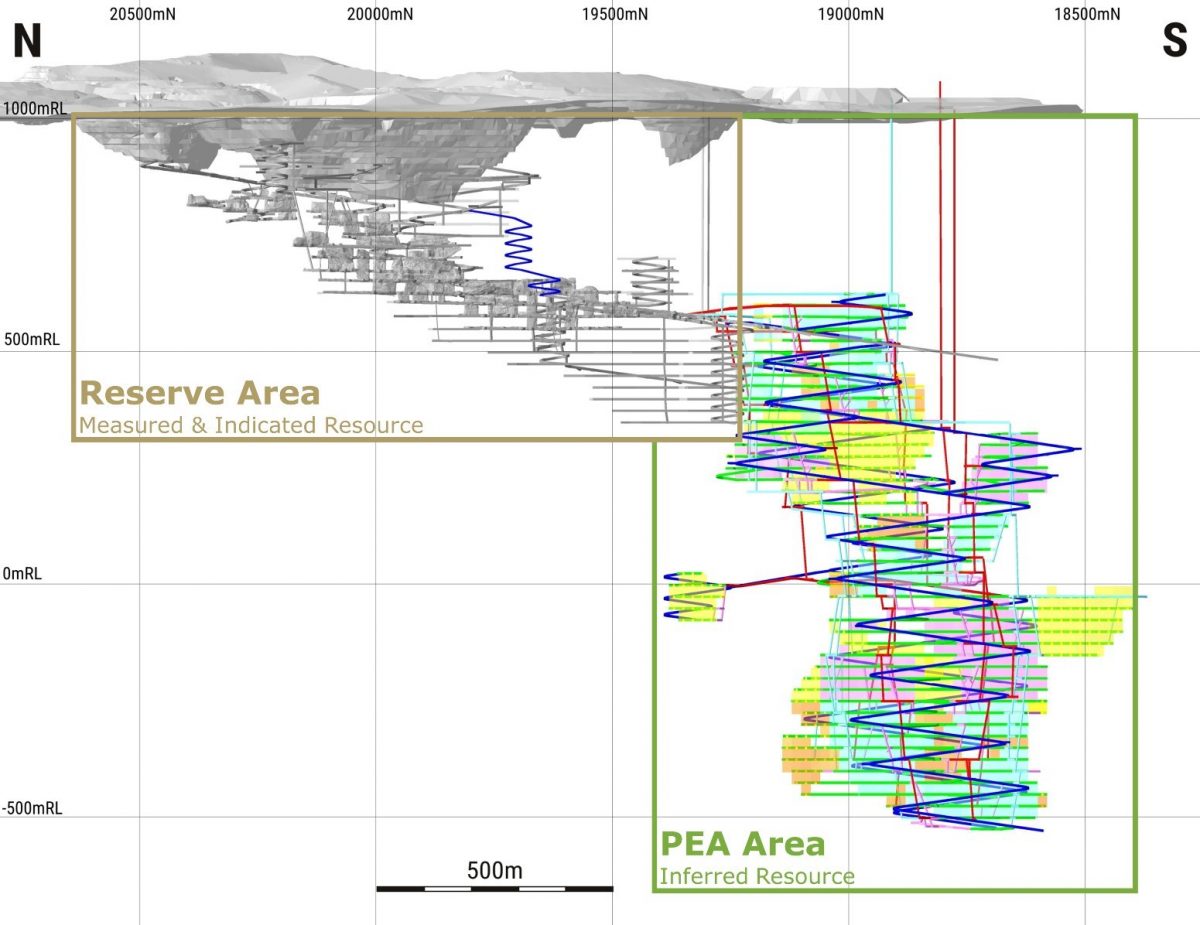
")
")
")
")


")