LOS ANGELES, Jan. 15, 2021 /PRNewswire/ — Despite a global pandemic that lingered most of the year, two lockdowns and a struggling economy, California’s housing market closed out 2020 on a high note, recording solid sales and a fifth record-high median price in December, the CALIFORNIA ASSOCIATION OF REALTORS® (C.A.R.) said today.
– Infographic: https://www.car.org/marketing/clients/infographics/December%202020%20Sales%20and%20Price
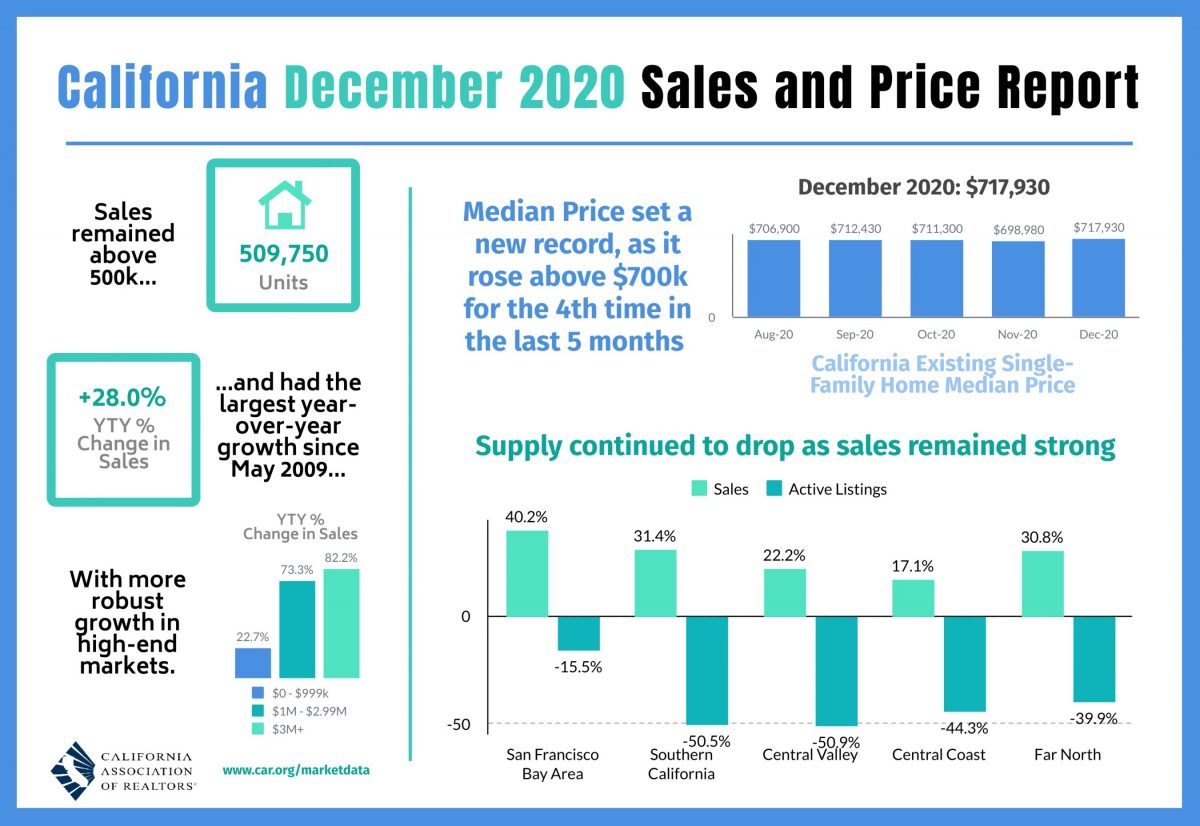
Closed escrow sales of existing, single-family detached homes in California totaled a seasonally adjusted annualized rate of 509,750 units in December, according to information collected by C.A.R. from more than 90 local REALTOR® associations and MLSs statewide. The statewide annualized sales figure represents what would be the total number of homes sold during 2020 if sales maintained the December pace throughout the year. It is adjusted to account for seasonal factors that typically influence home sales.
December home sales ticked up 0.2 percent from 508,820 in November and were up 28 percent from a year ago, when 398,370 homes were sold on an annualized basis. The year-over-year, double-digit sales gain was the fifth consecutive and the largest yearly gain since May 2009. For the year as a whole, annual home sales rose to a preliminary 411,870 closed escrow sales in California, up 3.5 percent from 2019’s pace of 397,960.
«It’s a testament to the strength of the market that even after the pandemic effectively shut down the spring home-buying season in 2020, the market still was able to recover the substantial sales lost in the first half of the year and even top 2019’s levels,» said C.A.R. President Dave Walsh, vice president and manager of the Compass San Jose office. «With mortgage rates expected to stay near the lowest in history, demand for homeownership will continue to be strong, so home sales should remain elevated into the first half of 2021, as motivated buyers take advantage of the increased purchasing power.»
After dipping below $700,000 the previous month, California’s median home price bounced back above that benchmark and set another record high in December. The statewide median home price rose 2.7 percent on a month-to-month basis to $717,930 in December, up from November’s $698,890. Home prices continued to gain on a year-over-year basis with the statewide median price surging 16.8 percent from $614,880 recorded last December. The double-digit increase from last year was the fifth in a row, and the month-to-month gain was higher than the long-run average of 0.8 percent observed between 1979 and 2019. The statewide median home price for the entire year was $659,380, an increase of 11.3 percent from a revised $592,230 in 2019.
«Home prices, which usually peak during the summer, were unseasonably strong in December,» said C.A.R. Vice President and Chief Economist Jordan Levine. «The imbalance between supply and demand continues to fuel home price gains as would-be home sellers remain reluctant to list their homes during the pandemic, contributing to a more-than-40-percent year-over-year decline in active listings for the seventh straight month.»
Perhaps due to increasing home prices, more consumers said it is a good time to sell, according to C.A.R.’s monthly Consumer Housing Sentiment Index. Conducted in early January, the poll found that 59 percent of consumers said it is a good time to sell, up from 55 percent a month ago, and up from 56 percent a year ago. Meanwhile, low interest rates continue to fuel the optimism for homebuying; one-fourth of the consumers who responded to the poll believed that now is a good time to buy a home, unchanged from last year.
Other key points from C.A.R.’s December 2020 resale housing report include:
- At the regional level, sales increased by double-digits in all major regions in December, with a year-over-year gain of over 20 percent for each region, except the Central Coast region. The San Francisco Bay Area remained on top with the highest gain of 40.2 percent over last year, followed by Southern California (31.4 percent), the Far North (30.8 percent) and the Central Valley (22.2 percent). Sales in the Central Coast region were softer than the other regions but still improved 17.1 percent from a year ago.
- For the year as a whole, all major regions except the Far North surpassed their 2019 sales levels. The Central Coast was the strongest market among all regions, with annual sales increasing 5.5 percent from 2019. Both the San Francisco Bay Area and Southern California recorded a sales improvement of 1.9 percent from last year, while the Central Valley inched up 0.3 percent. The Far North was the only major region that trailed behind last year’s level, with a slight dip of 0.3 percent.
- With homebuying interest remaining high, sales in resort communities continued to exhibit strong gains from the prior year. Mammoth Lakes saw the biggest sales increase in December, surging 116.7 percent from a year ago, followed by Lake Arrowhead (78.6 percent), Big Bear (54.1 percent) and South Lake Tahoe (31.7 percent). For the year 2020, sales increased 92.7 percent in Big Bear, 51 percent in Lake Arrowhead, 49.5 percent in South Lake Tahoe and 37.5 percent in Mammoth Lake.
- At the regional level, all major regions posted an increase in the median price from last year by more than 10 percent. The Central Coast region had the largest year-over-year price increase in December, gaining 17.9 percent from a year ago. The San Francisco Bay Area had the second largest increase of 16.4 percent, followed by the Central Valley (15.5 percent), the Far North (15.2 percent) and Southern California (13.0 percent).
- All but one of the 51 counties tracked by C.A.R. reported a year-over-year price gain, with 48 of them increasing by 10 percent or more. Mono had the highest price growth, with an increase of 120 percent year-over-year. Lassen was the only county whose median price dropped, declining 13.1 percent from a year ago.
- The surge in the coronavirus cases continues to play a role in the decrease in active listings as homeowners remain concerned about the worsening coronavirus pandemic situation. As a result, C.A.R.’s Unsold Inventory Index (UII) dropped to 1.3 months in December, matching the record-low set in spring 2004. The index indicates the number of months it would take to sell the supply of homes on the market at the current rate of sales.
- Active listings fell 47.1 percent from last year and continued to drop more than 40 percent on a year-over-year basis for the seventh straight month. On a month-to-month basis, for-sale properties dropped 18.6 percent in December, higher than the 5-year average of -14.0 percent, observed between 2015 and 2019.
- Except for the Bay Area, all major regions experienced a year-over-year decline of 35 percent or more in for-sale properties in December. The Central Valley had the biggest year-over-year drop of 50.9 percent in December, followed by Southern California (50.5 percent), the Central Coast (-44.3 percent), the Far North (-39.9 percent) and the San Francisco Bay Area (-15.5 percent).
- Forty-eight of the 51 counties reported by C.A.R. experienced a year-over-year decline in active listings in December. Merced had the biggest drop from last year, with a decline of 70.1 percent, followed by San Bernardino (-68.6%) and Sutter (-66.9%). Twenty counties had less than half the active listings they had in December 2019. San Francisco (115.1%), San Mateo (26.3%), and Santa Clara (7.7%) were the only counties in California with an increase in active listings from the prior year.
- The median number of days it took to sell a California single-family home was 11 days in December, down from 28 days in December 2019, and only 2 days longer than the lowest number of days ever recorded in the previous month.
- C.A.R.’s statewide sales-price-to-list-price ratio* was 100.1 percent in December 2020 and 98.3 percent in December 2019.
- The statewide average price per square foot** for an existing single-family home remained elevated and improved solidly on an annual basis. December’s price per square foot was $330 compared to $289 in December 2019. While the December 2020 figure did not set a new record, it was still the second highest statewide median price per square foot since August 2007.
- The 30-year, fixed-mortgage interest rate averaged 2.68 percent in December, down from 3.72 percent in December 2019, according to Freddie Mac. The five-year, adjustable mortgage interest rate was an average of 2.79 percent, compared to 3.39 percent in December 2019.
Note: The County MLS median price and sales data in the tables are generated from a survey of more than 90 associations of REALTORS® throughout the state and represent statistics of existing single-family detached homes only. County sales data are not adjusted to account for seasonal factors that can influence home sales. Movements in sales prices should not be interpreted as changes in the cost of a standard home. The median price is where half sold for more and half sold for less; medians are more typical than average prices, which are skewed by a relatively small share of transactions at either the lower end or the upper end. Median prices can be influenced by changes in cost, as well as changes in the characteristics and the size of homes sold. The change in median prices should not be construed as actual price changes in specific homes.
*Sales-to-list-price ratio is an indicator that reflects the negotiation power of home buyers and home sellers under current market conditions. The ratio is calculated by dividing the final sales price of a property by its last list price and is expressed as a percentage. A sales-to-list ratio with 100 percent or above suggests that the property sold for more than the list price, and a ratio below 100 percent indicates that the price sold below the asking price.
**Price per square foot is a measure commonly used by real estate agents and brokers to determine how much a square foot of space a buyer will pay for a property. It is calculated as the sale price of the home divided by the number of finished square feet. C.A.R. currently tracks price-per-square foot statistics for 50 counties.
Leading the way…® in California real estate for more than 110 years, the CALIFORNIA ASSOCIATION OF REALTORS® (www.car.org) is one of the largest state trade organizations in the United States with more than 200,000 members dedicated to the advancement of professionalism in real estate. C.A.R. is headquartered in Los Angeles.
|
December 2020 County Sales and Price Activity
|
|
(Regional and condo sales data not seasonally adjusted)
|
|
|
December 2020
|
Median Sold Price of Existing Single-Family Homes
|
Sales
|
|
State/Region/County
|
Dec.
2020
|
Nov.
2020
|
|
Dec.
2019
|
|
Price MTM% Chg
|
Price YTY% Chg
|
Sales MTM% Chg
|
Sales YTY% Chg
|
|
Calif. Single-family home
|
$717,930
|
$698,980
|
r
|
$614,880
|
|
2.7%
|
16.8%
|
0.2%
|
28.0%
|
|
Calif. Condo/Townhome
|
$520,000
|
$520,000
|
|
$477,000
|
|
0.0%
|
9.0%
|
8.3%
|
31.3%
|
|
Los Angeles Metro Area
|
$625,250
|
$630,000
|
|
$550,000
|
|
-0.8%
|
13.7%
|
14.3%
|
31.6%
|
|
Central Coast
|
$825,000
|
$825,000
|
|
$700,000
|
|
0.0%
|
17.9%
|
5.3%
|
17.1%
|
|
Central Valley
|
$395,000
|
$400,000
|
|
$342,000
|
|
-1.3%
|
15.5%
|
5.4%
|
22.2%
|
|
Far North
|
$325,000
|
$340,000
|
|
$282,000
|
|
-4.4%
|
15.2%
|
18.0%
|
30.8%
|
|
Inland Empire
|
$450,000
|
$450,000
|
|
$385,000
|
|
0.0%
|
16.9%
|
13.0%
|
34.9%
|
|
San Francisco Bay Area
|
$1,058,000
|
$1,100,000
|
|
$908,750
|
|
-3.8%
|
16.4%
|
1.5%
|
40.2%
|
|
Southern California
|
$650,000
|
$657,820
|
|
$575,000
|
|
-1.2%
|
13.0%
|
12.4%
|
31.4%
|
|
|
|
|
|
|
|
|
|
|
|
San Francisco Bay Area
|
|
|
|
|
|
|
|
|
|
|
Alameda
|
$1,060,000
|
$1,049,040
|
|
$881,500
|
|
1.0%
|
20.2%
|
5.4%
|
44.5%
|
|
Contra Costa
|
$763,000
|
$810,000
|
|
$665,000
|
|
-5.8%
|
14.7%
|
7.9%
|
52.4%
|
|
Marin
|
$1,459,000
|
$1,425,000
|
|
$1,300,000
|
|
2.4%
|
12.2%
|
-5.9%
|
59.6%
|
|
Napa
|
$842,000
|
$824,500
|
|
$765,000
|
|
2.1%
|
10.1%
|
26.0%
|
45.8%
|
|
San Francisco
|
$1,581,000
|
$1,697,500
|
|
$1,450,000
|
|
-6.9%
|
9.0%
|
5.6%
|
53.8%
|
|
San Mateo
|
$1,700,000
|
$1,650,000
|
|
$1,475,000
|
|
3.0%
|
15.3%
|
-2.9%
|
35.9%
|
|
Santa Clara
|
$1,375,000
|
$1,383,000
|
|
$1,225,000
|
|
-0.6%
|
12.2%
|
-8.8%
|
31.0%
|
|
Solano
|
$510,000
|
$505,250
|
|
$455,500
|
|
0.9%
|
12.0%
|
-3.8%
|
8.6%
|
|
Sonoma
|
$720,000
|
$715,000
|
|
$647,500
|
|
0.7%
|
11.2%
|
5.7%
|
39.4%
|
|
Southern California
|
|
|
|
|
|
|
|
|
|
|
Los Angeles
|
$709,500
|
$664,160
|
|
$641,340
|
|
6.8%
|
10.6%
|
22.1%
|
30.5%
|
|
Orange
|
$950,000
|
$930,000
|
|
$840,000
|
|
2.2%
|
13.1%
|
5.5%
|
25.1%
|
|
Riverside
|
$488,250
|
$490,000
|
|
$420,000
|
|
-0.4%
|
16.3%
|
15.8%
|
39.0%
|
|
San Bernardino
|
$378,500
|
$380,250
|
|
$320,000
|
|
-0.5%
|
18.3%
|
8.5%
|
28.2%
|
|
San Diego
|
$730,000
|
$740,000
|
|
$655,000
|
|
-1.4%
|
11.5%
|
4.4%
|
30.3%
|
|
Ventura
|
$740,000
|
$760,000
|
|
$657,000
|
|
-2.6%
|
12.6%
|
-1.4%
|
41.7%
|
|
Central Coast
|
|
|
|
|
|
|
|
|
|
|
Monterey
|
$785,000
|
$850,000
|
|
$613,250
|
|
-7.6%
|
28.0%
|
1.6%
|
18.4%
|
|
San Luis Obispo
|
$711,000
|
$699,500
|
|
$615,500
|
|
1.6%
|
15.5%
|
13.9%
|
35.1%
|
|
Santa Barbara
|
$970,000
|
$955,000
|
|
$770,000
|
|
1.6%
|
26.0%
|
0.7%
|
2.7%
|
|
Santa Cruz
|
$1,070,000
|
$1,050,000
|
|
$889,000
|
|
1.9%
|
20.4%
|
3.0%
|
11.1%
|
|
Central Valley
|
|
|
|
|
|
|
|
|
|
|
Fresno
|
$325,000
|
$323,500
|
|
$285,000
|
|
0.5%
|
14.0%
|
5.3%
|
9.2%
|
|
Glenn
|
$297,500
|
$334,750
|
|
$252,000
|
|
-11.1%
|
18.1%
|
28.6%
|
50.0%
|
|
Kern
|
$300,000
|
$290,000
|
|
$262,900
|
|
3.4%
|
14.1%
|
14.5%
|
43.1%
|
|
Kings
|
$281,750
|
$265,000
|
|
$255,000
|
|
6.3%
|
10.5%
|
17.6%
|
28.2%
|
|
Madera
|
$335,000
|
$320,000
|
|
$285,100
|
|
4.7%
|
17.5%
|
7.0%
|
35.6%
|
|
Merced
|
$315,000
|
$315,500
|
|
$278,800
|
|
-0.2%
|
13.0%
|
19.0%
|
-11.9%
|
|
Placer
|
$559,000
|
$552,650
|
|
$495,000
|
|
1.1%
|
12.9%
|
2.5%
|
32.6%
|
|
Sacramento
|
$442,250
|
$442,500
|
|
$385,000
|
|
-0.1%
|
14.9%
|
1.6%
|
24.9%
|
|
San Benito
|
$729,500
|
$665,590
|
|
$600,000
|
|
9.6%
|
21.6%
|
-39.7%
|
-6.4%
|
|
San Joaquin
|
$435,750
|
$441,500
|
|
$391,500
|
|
-1.3%
|
11.3%
|
9.7%
|
26.4%
|
|
Stanislaus
|
$380,000
|
$389,000
|
|
$335,000
|
|
-2.3%
|
13.4%
|
0.9%
|
14.8%
|
|
Tulare
|
$295,000
|
$280,000
|
|
$252,000
|
|
5.4%
|
17.1%
|
12.7%
|
9.1%
|
|
Far North
|
|
|
|
|
|
|
|
|
|
|
Butte
|
$408,460
|
$405,000
|
|
$351,720
|
|
0.9%
|
16.1%
|
24.1%
|
17.9%
|
|
Lassen
|
$215,000
|
$231,250
|
|
$247,500
|
|
-7.0%
|
-13.1%
|
-39.5%
|
-8.0%
|
|
Plumas
|
$305,000
|
$385,000
|
|
$270,500
|
|
-20.8%
|
12.8%
|
0.0%
|
50.0%
|
|
Shasta
|
$307,500
|
$327,250
|
|
$275,000
|
|
-6.0%
|
11.8%
|
35.0%
|
50.5%
|
|
Siskiyou
|
$228,000
|
$263,000
|
|
$225,000
|
|
-13.3%
|
1.3%
|
-31.4%
|
-16.7%
|
|
Tehama
|
$273,250
|
$371,000
|
|
$237,500
|
|
-26.3%
|
15.1%
|
41.9%
|
33.3%
|
|
Other Calif. Counties
|
|
|
|
|
|
|
|
|
|
|
Amador
|
$355,000
|
$360,000
|
|
$300,000
|
|
-1.4%
|
18.3%
|
20.3%
|
66.0%
|
|
Calaveras
|
$397,500
|
$407,120
|
|
$339,500
|
|
-2.4%
|
17.1%
|
-7.9%
|
79.2%
|
|
Del Norte
|
$346,000
|
$308,750
|
|
$276,780
|
|
12.1%
|
25.0%
|
70.0%
|
36.0%
|
|
El Dorado
|
$538,350
|
$585,000
|
|
$465,000
|
|
-8.0%
|
15.8%
|
-1.0%
|
64.2%
|
|
Humboldt
|
$370,000
|
$351,000
|
|
$318,500
|
|
5.4%
|
16.2%
|
0.8%
|
31.6%
|
|
Lake
|
$306,950
|
$317,000
|
|
$271,500
|
|
-3.2%
|
13.1%
|
-2.3%
|
31.3%
|
|
Mariposa
|
$380,000
|
$374,000
|
|
$299,900
|
|
1.6%
|
26.7%
|
-16.0%
|
75.0%
|
|
Mendocino
|
$540,000
|
$494,000
|
|
$447,000
|
|
9.3%
|
20.8%
|
4.3%
|
56.5%
|
|
Mono
|
$880,000
|
$806,000
|
|
$400,000
|
|
9.2%
|
120.0%
|
0.0%
|
40.0%
|
|
Nevada
|
$508,000
|
$466,250
|
|
$400,000
|
|
9.0%
|
27.0%
|
21.0%
|
44.0%
|
|
Sutter
|
$369,900
|
$370,000
|
|
$308,250
|
|
0.0%
|
20.0%
|
14.1%
|
19.1%
|
|
Tuolumne
|
$330,000
|
$337,500
|
|
$292,000
|
|
-2.2%
|
13.0%
|
24.2%
|
82.3%
|
|
Yolo
|
$515,000
|
$511,000
|
|
$441,000
|
|
0.8%
|
16.8%
|
7.0%
|
10.5%
|
|
Yuba
|
$360,000
|
$352,500
|
|
$299,850
|
|
2.1%
|
20.1%
|
-13.1%
|
4.3%
|
r = revised
NA = not available
|
December 2020 County Unsold Inventory and Days on Market
|
|
(Regional and condo sales data not seasonally adjusted)
|
|
|
December 2020
|
Unsold Inventory Index
|
Median Time on Market
|
|
State/Region/County
|
Dec.
2020
|
Nov.
2020
|
|
Dec.
2019
|
|
Dec.
2020
|
Nov.
2020
|
|
Dec.
2019
|
|
|
Calif. Single-family homes
|
1.3
|
1.9
|
|
2.5
|
|
11.0
|
9.0
|
|
28.0
|
|
|
Calif. Condo/Townhomes
|
1.6
|
2.2
|
|
2.1
|
|
17.0
|
14.0
|
|
28.0
|
|
|
Los Angeles Metro Area
|
1.4
|
2.1
|
|
2.8
|
|
11.0
|
10.0
|
|
31.0
|
|
|
Central Coast
|
1.7
|
2.1
|
|
2.7
|
|
11.0
|
10.0
|
|
38.0
|
|
|
Central Valley
|
1.3
|
1.6
|
|
2.2
|
|
8.0
|
7.0
|
|
22.0
|
|
|
Far North
|
2.1
|
3.0
|
|
4.0
|
|
19.0
|
14.5
|
|
47.0
|
|
|
Inland Empire
|
1.4
|
2.1
|
|
3.3
|
|
12.0
|
11.0
|
|
38.0
|
|
|
San Francisco Bay Area
|
1.1
|
1.6
|
|
1.4
|
|
13.0
|
11.0
|
|
27.0
|
|
|
Southern California
|
1.3
|
2.0
|
|
2.7
|
|
10.0
|
9.0
|
|
28.0
|
|
|
|
|
|
|
|
|
|
|
|
|
|
San Francisco Bay Area
|
|
|
|
|
|
|
|
|
|
|
|
Alameda
|
0.8
|
1.3
|
|
0.9
|
|
9.0
|
8.0
|
|
20.0
|
|
|
Contra Costa
|
0.9
|
1.3
|
|
1.4
|
|
8.0
|
7.0
|
|
23.0
|
|
|
Marin
|
1.0
|
1.5
|
|
1.7
|
|
28.0
|
25.5
|
|
59.0
|
|
|
Napa
|
2.3
|
3.7
|
|
3.6
|
|
37.0
|
35.0
|
|
65.0
|
|
|
San Francisco
|
1.2
|
2.0
|
|
0.8
|
|
27.0
|
18.0
|
|
20.0
|
|
|
San Mateo
|
1.1
|
1.8
|
|
1.1
|
|
12.0
|
11.0
|
|
23.0
|
|
|
Santa Clara
|
1.1
|
1.4
|
|
1.1
|
|
9.0
|
8.0
|
|
19.0
|
|
|
Solano
|
1.4
|
1.7
|
|
2.2
|
|
29.0
|
27.5
|
|
38.5
|
|
|
Sonoma
|
2.1
|
2.7
|
|
3.0
|
|
37.0
|
33.0
|
|
56.5
|
|
|
Southern California
|
|
|
|
|
|
|
|
|
|
|
|
Los Angeles
|
1.4
|
2.1
|
|
2.4
|
|
10.0
|
9.0
|
|
24.0
|
|
|
Orange
|
1.3
|
2.0
|
|
2.3
|
|
11.0
|
10.0
|
|
29.0
|
|
|
Riverside
|
1.4
|
2.1
|
|
3.4
|
|
13.0
|
11.0
|
|
36.0
|
|
|
San Bernardino
|
1.3
|
2.0
|
|
3.3
|
|
11.0
|
10.0
|
|
42.0
|
|
|
San Diego
|
1.2
|
1.6
|
|
2.2
|
|
8.0
|
7.0
|
|
20.0
|
|
|
Ventura
|
1.1
|
1.7
|
|
3.8
|
|
27.0
|
27.0
|
|
51.0
|
|
|
Central Coast
|
|
|
|
|
|
|
|
|
|
|
|
Monterey
|
2.0
|
2.3
|
|
3.0
|
|
10.0
|
11.0
|
|
28.5
|
|
|
San Luis Obispo
|
1.6
|
2.2
|
|
3.3
|
|
10.0
|
10.5
|
|
41.5
|
|
|
Santa Barbara
|
1.6
|
2.0
|
|
2.6
|
|
15.0
|
10.0
|
|
35.5
|
|
|
Santa Cruz
|
1.4
|
2.0
|
|
1.7
|
|
10.5
|
8.0
|
|
44.0
|
|
|
Central Valley
|
|
|
|
|
|
|
|
|
|
|
|
Fresno
|
1.4
|
1.8
|
|
2.5
|
|
7.0
|
7.0
|
|
18.5
|
|
|
Glenn
|
2.2
|
3.4
|
|
5.4
|
|
5.0
|
26.5
|
|
24.0
|
|
|
Kern
|
1.5
|
2.1
|
|
2.3
|
|
11.0
|
8.0
|
|
20.0
|
|
|
Kings
|
1.3
|
2.0
|
|
2.8
|
|
7.0
|
6.0
|
|
20.0
|
|
|
Madera
|
1.9
|
2.1
|
|
4.5
|
|
13.0
|
14.0
|
|
27.0
|
|
|
Merced
|
1.3
|
2.0
|
|
2.7
|
|
14.0
|
10.5
|
|
34.0
|
|
|
Placer
|
1.1
|
1.5
|
|
1.9
|
|
7.0
|
8.0
|
|
27.0
|
|
|
Sacramento
|
1.0
|
1.3
|
|
1.6
|
|
7.0
|
7.0
|
|
19.0
|
|
|
San Benito
|
2.0
|
1.4
|
|
2.5
|
|
9.0
|
9.0
|
|
27.0
|
|
|
San Joaquin
|
1.0
|
1.4
|
|
2.4
|
|
8.0
|
7.0
|
|
25.0
|
|
|
Stanislaus
|
1.3
|
1.6
|
|
2.0
|
|
8.0
|
7.0
|
|
20.0
|
|
|
Tulare
|
1.5
|
2.0
|
|
2.6
|
|
8.5
|
7.0
|
|
23.0
|
|
|
Far North
|
|
|
|
|
|
|
|
|
|
|
|
Butte
|
1.4
|
2.5
|
|
2.7
|
|
7.0
|
7.0
|
|
42.0
|
|
|
Lassen
|
3.7
|
2.5
|
|
4.5
|
|
100.0
|
72.5
|
|
148.0
|
|
|
Plumas
|
2.9
|
3.8
|
|
6.7
|
|
91.0
|
118.0
|
|
168.0
|
|
|
Shasta
|
1.8
|
3.0
|
|
4.0
|
|
17.0
|
8.0
|
|
30.5
|
|
|
Siskiyou
|
3.7
|
2.9
|
|
5.5
|
|
31.0
|
11.0
|
|
39.0
|
|
|
Tehama
|
3.4
|
5.1
|
|
5.3
|
|
45.5
|
41.0
|
|
91.0
|
|
|
Other Calif. Counties
|
|
|
|
|
|
|
|
|
|
|
|
Amador
|
1.9
|
2.7
|
|
5.4
|
|
23.0
|
17.0
|
|
58.5
|
|
|
Calaveras
|
1.5
|
1.8
|
|
4.9
|
|
61.0
|
62.5
|
|
87.0
|
|
|
Del Norte
|
2.2
|
5.3
|
|
5.1
|
|
127.0
|
116.0
|
|
142.0
|
|
|
El Dorado
|
1.3
|
1.6
|
|
3.6
|
|
20.0
|
18.0
|
|
57.0
|
|
|
Humboldt
|
1.8
|
2.2
|
|
4.2
|
|
12.0
|
12.5
|
|
35.5
|
|
|
Lake
|
2.5
|
3.5
|
|
5.8
|
|
35.0
|
27.0
|
|
64.5
|
|
|
Mariposa
|
2.8
|
3.1
|
|
7.4
|
|
73.0
|
34.0
|
|
67.0
|
|
|
Mendocino
|
2.6
|
3.3
|
|
6.3
|
|
67.0
|
51.0
|
|
68.0
|
|
|
Mono
|
2.0
|
2.5
|
|
6.9
|
|
106.0
|
105.0
|
|
148.0
|
|
|
Nevada
|
1.8
|
2.7
|
|
3.6
|
|
20.0
|
11.5
|
|
34.0
|
|
|
Sutter
|
0.9
|
1.4
|
|
2.2
|
|
10.0
|
6.0
|
|
35.0
|
|
|
Tuolumne
|
1.9
|
2.8
|
|
5.8
|
|
30.0
|
24.5
|
|
60.5
|
|
|
Yolo
|
1.4
|
1.9
|
|
2.1
|
|
13.0
|
9.0
|
|
29.0
|
|
|
Yuba
|
1.2
|
1.2
|
|
2.7
|
|
7.0
|
9.0
|
|
26.5
|
|
r = revised
NA = not available
 View original content to download multimedia:http://www.prnewswire.com/news-releases/california-housing-market-ends-year-on-high-note-as-sales-continue-strong-in-december-and-median-price-reaches-another-record-high-car-reports-301209396.html
SOURCE CALIFORNIA ASSOCIATION OF REALTORS® (C.A.R.)


")
