Services PMI® at 55.3%; February 2021 Services ISM® Report On Business®

Business Activity Index at 55.5%; New Orders Index at 51.9%; Employment Index at 52.7%; Supplier Deliveries Index at 60.8% 

TEMPE, Ariz., March 3, 2021 /PRNewswire/ — Economic activity in the services sector grew in February for the ninth month in a row, say the nation’s purchasing and supply executives in the latest Services ISM® Report On Business®.

…

Business Activity Index at 55.5%; New Orders Index at 51.9%; Employment Index at 52.7%; Supplier Deliveries Index at 60.8% 

TEMPE, Ariz., March 3, 2021 /PRNewswire/ — Economic activity in the services sector grew in February for the ninth month in a row, say the nation’s purchasing and supply executives in the latest Services ISM® Report On Business®.

The report was issued today by Anthony Nieves, CPSM, C.P.M., A.P.P., CFPM, Chair of the Institute for Supply Management® (ISM®) Services Business Survey Committee: «The Services PMI® registered 55.3 percent, 3.4 percentage points lower than the January reading of 58.7 percent. This reading indicates the ninth straight month of growth for the services sector, which has expanded for all but two of the last 133 months.

«The Supplier Deliveries Index registered 60.8 percent, up 3 percentage points from January’s reading of 57.8 percent. (Supplier Deliveries is the only ISM®Report On Business® index that is inversed; a reading of above 50 percent indicates slower deliveries, which is typical as the economy improves and customer demand increases.)

«The Prices Index figure of 71.8 percent is 7.6 percentage points higher than the January reading of 64.2 percent, indicating that prices increased in February, and at a faster rate. According to the Services PMI®, 17 services industries reported growth. The composite index indicated growth for the ninth consecutive month after a two-month contraction in April and May. There was a pullback in the rate of growth in the services sector in February. Respondents are mostly optimistic about business recovery and the economy. Production-capacity constraints, material shortages and challenges in logistics and human resources are impacting the supply chain,» says Nieves.

INDUSTRY PERFORMANCE
The 17 services industries reporting growth in February — listed in order — are: Accommodation & Food Services; Wholesale Trade; Transportation & Warehousing; Construction; Arts, Entertainment & Recreation; Public Administration; Utilities; Health Care & Social Assistance; Retail Trade; Professional, Scientific & Technical Services; Finance & Insurance; Management of Companies & Support Services; Information; Agriculture, Forestry, Fishing & Hunting; Educational Services; Other Services; and Mining. The only industry reporting contraction in February is Real Estate, Rental & Leasing.

WHAT RESPONDENTS ARE SAYING

  • «Suppliers are taking the opportunity with the commodity-price increases in the last few months to propose price increases that are above and beyond normal expectations, causing significant concern. Business growth remains optimistic on the emergence of a post-coronavirus [COVID-19] era in [the] second half of 2021. U.S. port delays are problematic.» (Accommodation & Food Services)
  • «The declining COVID-19 cases in the four states we operate in, combined with the increased vaccination rates, should bode well for our increased business activity moving into the second quarter of 2021.» (Arts, Entertainment & Recreation)
  • «Sales of residential real estate continue to be strong, even outstripping supply. Cost inflation in building materials seen as shortages develop from sporadic COVID-19 closures at manufacturing facilities. Port congestion on the West Coast [and] winter weather in Canada closing mills and restricting truck shipping are contributing to product shortages nationwide.» (Construction)
  • «COVID-19 restrictions continue to affect the number of students either applying to college, living on campus or finding alternative means of a valuable education. As such, revenues have decreased while expenses increased.» (Educational Services)
  • «Business is steady during Q1 2021.» (Finance & Insurance)
  • «Exponential demand for critical supplies due to [the] pandemic is driving distributer allocations and forcing alternative sourcing.» (Health Care & Social Assistance)
  • «Our company has an overall positive outlook, with new COVID-19 cases trending down nationally and vaccine distribution coming online. However, possible changes to the regulatory environment for oil and gas is a looming negative influence.» (Management of Companies & Support Services)
  • «The business continues to reduce real-estate/brick-and-mortar [operations] and transition to a work-from-home model. Innovation is the watchword in all things; as such, the need to right-size all consumption as patterns have changed.» (Information)
  • «Supplier deliveries continue to be an issue as well as lead-times. Additionally, price increases are occurring with more frequency for products containing raw materials such as copper and steel.» (Retail Trade)
  • «Construction and customer activity remains robust. Many materials have inconsistent lead times or are facing delivery delays.» (Utilities)
  • «We are seeing an ongoing influx of price increases due to raw-material shortages, labor shortages, and transportation delays.» (Wholesale Trade)
  • «We were excited [in January], when orders and activity were increasing. Now, they are not receding, but they’re flat month over month. That’s not the rebound we were hoping for.» (Professional, Scientific & Technical Services) 

ISM® SERVICES SURVEY RESULTS AT A GLANCE

COMPARISON OF ISM® SERVICES AND ISM® MANUFACTURING SURVEYS

February 2021

Index

 Services PMI®

Manufacturing PMI®

Series
Index

Feb

Series
Index

Jan

Percent
Point
Change


Direction


Rate of
Change


Trend**

(Months)

Series
Index

Feb

Series
Index

Jan

Percent
Point
Change

Services
PMI®

55.3

58.7

-3.4

Growing

Slower

9

60.8

58.7

+2.1

Business
Activity/

Production

55.5

59.9

-4.4

Growing

Slower

9

63.2

60.7

+2.5

New Orders

51.9

61.8

-9.9

Growing

Slower

9

64.8

61.1

+3.7

Employment

52.7

55.2

-2.5

Growing

Slower

2

54.4

52.6

+1.8

Supplier
Deliveries

60.8

57.8

+3.0

Slowing

Faster

21

72.0

68.2

+3.8

Inventories

58.9

49.2

+9.7

Growing

From
Contracting

1

49.7

50.8

-1.1

Prices

71.8

64.2

+7.6

Increasing

Faster

45

86.0

82.1

+3.9

Backlog of
Orders

55.2

50.9

+4.3

Growing

Faster

2

64.0

59.7

+4.3

New Export
Orders

57.6

47.0

+10.6

Growing

From
Contracting

1

57.2

54.9

+2.3

Imports

50.5

53.5

-3.0

Growing


Slower

5

56.1

56.8

-0.7

Inventory
Sentiment

54.3

49.7

+4.6

Too High

From Too
Low

1

N/A

N/A

N/A

Customers’
Inventories

N/A

N/A

N/A

N/A

N/A

N/A

32.5

33.1

-0.6

Overall Economy

Growing

Slower

9

Services Sector

Growing

Slower

9

Services ISM® Report On Business® data is seasonally adjusted for the Business Activity, New Orders, Prices and Employment indexes. Manufacturing ISM® Report On Business® data is seasonally adjusted for New Orders, Production, Employment and Inventories indexes.
**Number of months moving in current direction.

COMMODITIES REPORTED UP/DOWN IN PRICE, AND IN SHORT SUPPLY

Commodities Up in Price
Aluminum (2); Cheese Products; Corn; Copper (2); Copper Products; Diesel (3); Electronic Components; Electrical Components; Energy; Exam Gloves (5); Freight (3); Fuel (2); Gasoline (3); Labor (3); Labor — Temporary (2); Lumber (2); Natural Gas; Nitrile Gloves (6); Oil Products; Oriented Strand Board (OSB) (3); Personal Protective Equipment (PPE)* (13); PPE — Gloves (5); Polyvinyl Chloride (PVC) Products (6); Pharmaceuticals (2); Protein; Resin Products (2); Steel (6); Steel Products (2); and Wood Products.

Commodities Down in Price
Personal Protective Equipment (PPE)*.

Commodities in Short Supply
Ammunition; Appliances (2); Construction Contractors (5); COVID-19 Vaccine; Electrical Components (3); Exam Gloves; Gloves (3); Insulation; Labor (3); Labor — Construction (2); Labor — Temporary (2); N95 Masks (12); Needles & Syringes (3); Nitrile Gloves (9); Oriented Strand Board (OSB) (2); Packaging; Paper Products; Personal Protective Equipment (PPE) (13); PPE — Gloves (11); PPE — Gowns; Plastic Bags; Polyvinyl Chloride (PVC) Products; Refrigerators; Shipping Containers; and Steel Products (3).

Note: The number of consecutive months the commodity is listed is indicated after each item.
*Indicates both up and down in price.

FEBRUARY 2021 SERVICES INDEX SUMMARIES

Services PMI®

In February, the Services PMI® registered 55.3 percent, 3.4 percentage points lower than January figure of 58.7 percent. This reading indicates the services sector grew for the ninth consecutive month after two months of contraction and 123 months of growth before that. A reading above 50 percent indicates the services sector economy is generally expanding; below 50 percent indicates the services sector is generally contracting.

A Services PMI® above 49.2 percent, over time, generally indicates an expansion of the overall economy. Therefore, the February Services PMI® indicates expansion for a ninth straight month following two months of contraction and a preceding period of 128 months of growth. Nieves says, «The past relationship between the Services PMI® and the overall economy indicates that the Services PMI® for February (55.3 percent) corresponds to a 2.2 -percent increase in real gross domestic product (GDP) on an annualized basis.»

SERVICES PMI® HISTORY

Month

Services PMI®

Month

Services PMI®

Feb 2021

55.3

Aug 2020

57.2

Jan 2021

58.7

Jul 2020

56.6

Dec 2020

57.7

Jun 2020

56.5

Nov 2020

56.8

May 2020

45.4

Oct 2020

56.2

Apr 2020

41.6

Sep 2020

57.2

Mar 2020

53.6

Average for 12 months – 54.4

High – 58.7

Low – 41.6

Business Activity
ISM®‘s Business Activity Index registered 55.5 percent in February, a decrease of 4.4 percentage points from the January reading of 59.9 percent. This represents growth for the ninth consecutive month. Comments from respondents include: «State restrictions on dining capacity have relaxed slightly» and «Elective surgeries on the rise.»

The 14 industries reporting an increase in business activity for the month of February — listed in order — are: Accommodation & Food Services; Arts, Entertainment & Recreation; Wholesale Trade; Transportation & Warehousing; Public Administration; Utilities; Educational Services; Management of Companies & Support Services; Construction; Mining; Finance & Insurance; Health Care & Social Assistance; Information; and Professional, Scientific & Technical Services. The three industries reporting a decrease are: Real Estate, Rental & Leasing; Agriculture, Forestry, Fishing & Hunting; and Other Services. Retail Trade is the only industry reporting no change in February compared to January.

Business Activity

%Higher

%Same

%Lower

Index

Feb 2021

26.2

59.3

14.6

55.5

Jan 2021

29.7

51.4

18.8

59.9

Dec 2020

31.4

50.4

18.2

60.5

Nov 2020

27.5

57.0

15.4

59.6

New Orders
ISM®‘s New Orders Index registered 51.9 percent, a decrease of 9.9 percentage points from the January reading of 61.8 percent. New orders grew for the ninth consecutive month after two months of contraction and a preceding period of 128 months of expansion. Comments from respondents include: «An increase in inventories needed to meet new demands» and «Increased demand due to building stock to cover through the Lunar New Year.»

The 11 industries reporting growth of new orders in February — listed in order — are: Wholesale Trade; Accommodation & Food Services; Construction; Public Administration; Transportation & Warehousing; Professional, Scientific & Technical Services; Management of Companies & Support Services; Utilities; Educational Services; Finance & Insurance; and Health Care & Social Assistance. The two industries reporting a decrease in February are: Real Estate, Rental & Leasing; and Other Services.

New Orders

%Higher

%Same

%Lower

Index

Feb 2021

27.0

54.9

18.1

51.9

Jan 2021

30.5

51.6

17.9

61.8

Dec 2020

30.3

49.9

19.7

58.6

Nov 2020

29.6

55.2

15.1

59.0

Employment
Employment activity in the services sector grew in February for the second consecutive month after contracting in January. After 72 straight pre-pandemic months of expansion, the index contracted from March through September. ISM®‘s Services Employment Index registered 52.7 percent in February, down 2.5 percentage points from the January reading of 55.2 percent. Comments from respondents include: «Unable to fill vacant positions with qualified applicants» and «Need more resources to meet demand.»

The 11 industries reporting an increase in employment in February — listed in order — are: Arts, Entertainment & Recreation; Health Care & Social Assistance; Management of Companies & Support Services; Accommodation & Food Services; Construction; Other Services; Retail Trade; Utilities; Public Administration; Information; and Finance & Insurance. The six industries that reported a reduction in employment in February — listed in order — are: Mining; Real Estate, Rental & Leasing; Transportation & Warehousing; Educational Services; Wholesale Trade; and Professional, Scientific & Technical Services.

Employment

%Higher

%Same

%Lower

Index

Feb 2021

16.4

69.2

14.3

52.7

Jan 2021

16.2

73.0

10.8

55.2

Dec 2020

14.6

66.8

18.6

48.7

Nov 2020

16.0

69.6

14.5

51.5

Supplier Deliveries
The Supplier Deliveries Index registered 60.8 percent, which is 3 percentage points higher than the 57.8 percent reported in January. A reading above 50 percent indicates slower deliveries, while a reading below 50 percent indicates faster deliveries. Comments from respondents include: «Import logistics delays,» and «Trucking shortage is delaying orders two to five days.»

The 15 industries reporting slower deliveries in February — listed in order — are: Transportation & Warehousing; Construction; Agriculture, Forestry, Fishing & Hunting; Real Estate, Rental & Leasing; Retail Trade; Wholesale Trade; Other Services; Mining; Health Care & Social Assistance; Utilities; Accommodation & Food Services; Public Administration; Professional, Scientific & Technical Services; Information; and Finance & Insurance. The two industries reporting faster deliveries in February are: Management of Companies & Support Services; and Educational Services.

Supplier Deliveries

%Slower

%Same

%Faster

Index

Feb 2021

25.7

70.2

4.0

60.8

Jan 2021

18.4

78.8

2.8

57.8

Dec 2020

27.6

70.4

2.0

62.8

Nov 2020

16.9

80.3

2.8

57.1

Inventories
The Inventories Index grew in February after a month of contraction. The reading of 58.9 percent was a 9.7-percentage point increase from the 49.2 percent reported in January. Of the total respondents in February, 46 percent indicated they do not have inventories or do not measure them. Comments from respondents include: «Increasing on-hand inventories to meet new business demands» and «Increasing stock of appliances since they are in short supply to meet our needs.»

The seven industries reporting an increase in inventories in February — listed in order — are: Arts, Entertainment & Recreation; Real Estate, Rental & Leasing; Educational Services; Management of Companies & Support Services; Mining; Public Administration; and Wholesale Trade. The four industries reporting a decrease in inventories in February are: Retail Trade; Construction; Utilities; and Health Care & Social Assistance. Seven industries reported no change in inventories in February.

Inventories

%Higher

%Same

%Lower

Index

Feb 2021

31.0

55.9

13.1

58.9

Jan 2021

17.0

64.6

18.5

49.2

Dec 2020

28.6

59.2

12.2

58.2

Nov 2020

19.6

59.4

21.0

49.3

Prices
Prices paid by service organizations for materials and services increased in February, with the index registering 71.8 percent. This is 7.6 percentage points higher than the 64.2 percent reported in January.

The 16 services industries that reported an increase in prices paid during the month of February — listed in order — are: Accommodation & Food Services; Construction; Wholesale Trade; Real Estate, Rental & Leasing; Agriculture, Forestry, Fishing & Hunting; Mining; Transportation & Warehousing; Retail Trade; Public Administration; Health Care & Social Assistance; Finance & Insurance; Utilities; Other Services; Professional, Scientific & Technical Services; Educational Services; and Management of Companies & Support Services. The only industry reporting a decrease in prices paid for February is Information.

Prices

%Higher

%Same

%Lower

Index

Feb 2021

43.0

54.2

2.7

71.8

Jan 2021

32.0

63.3

4.8

64.2

Dec 2020

26.5

68.4

5.1

64.4

Nov 2020

32.0

62.2

5.8

63.9

NOTE: Commodities reported as up in price and down in price are listed in the commodities section of this report.

Backlog of Orders
The ISM® Services Backlog of Orders Index grew in February for the eighth time in the last nine months. The index registered 55.2 percent; 4.3 percentage points higher than the 50.9 percent reported in January. Of the total respondents in February, 54 percent indicated they do not measure backlog of orders.

The eight industries reporting an increase in order backlogs in February — listed in order — are: Real Estate, Rental & Leasing; Transportation & Warehousing; Utilities; Construction; Wholesale Trade; Educational Services; Finance & Insurance; and Professional, Scientific & Technical Services. The six industries that reported a decrease in backlogs in February are: Arts, Entertainment & Recreation; Management of Companies & Support Services; Other Services; Public Administration; Information; and Mining.

Backlog of Orders

%Higher

%Same

%Lower

Index

Feb 2021

25.2

60.1

14.7

55.2

Jan 2021

13.9

74.0

12.1

50.9

Dec 2020

15.2

67.0

17.8

48.7

Nov 2020

19.0

63.3

17.6

50.7

New Export Orders
Orders and requests for services and other non-manufacturing activities to be provided outside of the U.S. by domestically based companies grew in February after contracting in January. The New Export Orders Index registered 57.6 percent in February, which is 10.6 percentage points higher than the 47 percent reported in January. Of the total respondents in February, 76 percent indicated they either do not perform, or do not separately measure, orders for work outside of the U.S.

The seven industries reporting an increase in new export orders in February — listed in order — are: Real Estate, Rental & Leasing; Arts, Entertainment & Recreation; Educational Services; Finance & Insurance; Health Care & Social Assistance; Wholesale Trade; and Professional, Scientific & Technical Services. The three industries that reported a decrease in exports in February are: Other Services; Construction; and Retail Trade. Eight industries reported no change in February.

New Export Orders

%Higher

%Same

%Lower

Index

Feb 2021

21.9

71.4

6.8

57.6

Jan 2021

13.2

67.7

19.2

47.0

Dec 2020

20.2

74.2

5.6

57.3

Nov 2020

15.0

70.8

14.2

50.4

Imports
The Imports Index grew at a slower rate in February, as it registered 50.5 percent, 3 percentage points lower than January’s figure of 53.5 percent. Seventy-seven percent of respondents reported that they do not use, or do not track the use of, imported materials.

The seven industries reporting an increase in imports for the month of February — listed in order — are: Accommodation & Food Services; Real Estate, Rental & Leasing; Transportation & Warehousing; Wholesale Trade; Health Care & Social Assistance; Information; and Professional, Scientific & Technical Services. The four industries reporting a decrease in imports in February are: Retail Trade; Management of Companies & Support Services; Agriculture, Forestry, Fishing & Hunting; and Educational Services. Seven industries reported no change.

Imports

%Higher

%Same

%Lower

Index

Feb 2021

16.8

67.4

15.8

50.5

Jan 2021

14.9

77.0

8.0

53.5

Dec 2020

8.8

86.0

5.2

51.8

Nov 2020

17.3

75.3

7.4

55.0

Inventory Sentiment
The ISM® Services Inventory Sentiment Index in February registered 54.3 percent, which is 4.6 percentage points higher than the 49.7 percent reading in January. This indicates inventories are too high after three months of index contraction.

The eight industries reporting sentiment that their inventories were too high in February — listed in order — are: Arts, Entertainment & Recreation; Mining; Real Estate, Rental & Leasing; Other Services; Health Care & Social Assistance; Utilities; Information; and Public Administration. The three industries reporting a feeling that their inventories were too low in February are: Retail Trade; Transportation & Warehousing; and Wholesale Trade. Seven industries reported no change in inventory sentiment.

Inventory
Sentiment

%Too

High

%About
Right

%Too

Low

Index

Feb 2021

19.4

69.7

10.9

54.3

Jan 2021

13.0

73.4

13.6

49.7

Dec 2020

10.2

75.1

14.8

47.7

Nov 2020

12.3

75.3

12.4

49.9

About This Report
DO NOT CONFUSE THIS NATIONAL REPORT with the various regional purchasing reports released across the country. The national report’s information reflects the entire U.S., while the regional reports contain primarily regional data from their local vicinities. Also, the information in the regional reports is not used in calculating the results of the national report. The information compiled in this report is for the month of February 2021.

The data presented herein is obtained from a survey of supply executives in the services sector based on information they have collected within their respective organizations. ISM® makes no representation, other than that stated within this release, regarding the individual company data collection procedures. The data should be compared to all other economic data sources when used in decision-making.

Data and Method of Presentation
The Services ISM® Report On Business® (formerly the Non-Manufacturing ISM® Report On Business®) is based on data compiled from purchasing and supply executives nationwide. Membership of the Services Business Survey Committee (formerly Non-Manufacturing Business Survey Committee) is diversified by NAICS, based on each industry’s contribution to gross domestic product (GDP). The Services Business Survey Committee responses are divided into the following NAICS code categories: Agriculture, Forestry, Fishing & Hunting; Mining; Utilities; Construction; Wholesale Trade; Retail Trade; Transportation & Warehousing; Information; Finance & Insurance; Real Estate, Rental & Leasing; Professional, Scientific & Technical Services; Management of Companies & Support Services; Educational Services; Health Care & Social Assistance; Arts, Entertainment & Recreation; Accommodation & Food Services; Public Administration; and Other Services (services such as Equipment & Machinery Repairing; Promoting or Administering Religious Activities; Grantmaking; Advocacy; and Providing Dry-Cleaning & Laundry Services, Personal Care Services, Death Care Services, Pet Care Services, Photofinishing Services, Temporary Parking Services, and Dating Services).

Survey responses reflect the change, if any, in the current month compared to the previous month. For each of the indicators measured (Business Activity, New Orders, Backlog of Orders, New Export Orders, Inventory Change, Inventory Sentiment, Imports, Prices, Employment and Supplier Deliveries), this report shows the percentage reporting each response and the diffusion index. Responses represent raw data and are never changed. Data is seasonally adjusted for Business Activity, New Orders, Prices and Employment. All seasonal adjustment factors are subject annually to relatively minor changes when conditions warrant them. The remaining indexes have not indicated significant seasonality.

The Services PMI® is a composite index based on the diffusion indexes for four of the indicators with equal weights: Business Activity (seasonally adjusted), New Orders (seasonally adjusted), Employment (seasonally adjusted) and Supplier Deliveries. Diffusion indexes have the properties of leading indicators and are convenient summary measures showing the prevailing direction of change and the scope of change. An index reading above 50 percent indicates that the services economy is generally expanding; below 50 percent indicates that it is generally declining. Supplier Deliveries is an exception. A Supplier Deliveries Index above 50 percent indicates slower deliveries and below 50 percent indicates faster deliveries.

A Services PMI® above 49.2 percent, over time, indicates that the overall economy, or gross domestic product (GDP), is generally expanding; below 49.2 percent, it is generally declining. The distance from 50 percent or 49.2 percent is indicative of the strength of the expansion or decline.

The Services ISM® Report On Business® survey is sent out to Services Business Survey Committee respondents the first part of each month. Respondents are asked to ONLY report on U.S. operations for the current month. ISM® receives survey responses throughout most of any given month, with the majority of respondents generally waiting until late in the month to submit responses to give the most accurate picture of current business activity. ISM® then compiles the report for release on the third business day of the following month.

The industries reporting growth, as indicated in the Services ISM® Report On Business® monthly report, are listed in the order of most growth to least growth. For the industries reporting contraction or decreases, those are listed in the order of the highest level of contraction/decrease to the least level of contraction/decrease.

ISM ROB Content
The Institute for Supply Management® («ISM») Report On Business® (Manufacturing, Services and Hospital reports) («ISM ROB») contains information, text, files, images, video, sounds, musical works, works of authorship, applications, and any other materials or content (collectively, «Content») of ISM («ISM ROB Content»). ISM ROB Content is protected by copyright, trademark, trade secret, and other laws, and as between you and ISM, ISM owns and retains all rights in the ISM ROB Content. ISM hereby grants you a limited, revocable, nonsublicensable license to access and display on your individual device the ISM ROB Content (excluding any software code) solely for your personal, non-commercial use. The ISM ROB Content shall also contain Content of users and other ISM licensors. Except as provided herein or as explicitly allowed in writing by ISM, you shall not copy, download, stream, capture, reproduce, duplicate, archive, upload, modify, translate, publish, broadcast, transmit, retransmit, distribute, perform, display, sell, or otherwise use any ISM ROB Content.

Except as explicitly and expressly permitted by ISM, you are strictly prohibited from creating works or materials (including, but not limited to: tables, charts, data streams, time-series variables, fonts, icons, link buttons, wallpaper, desktop themes, online postcards, montages, mashups and similar videos, greeting cards, and unlicensed merchandise) that derive from or are based on the ISM ROB Content. This prohibition applies regardless of whether the derivative works or materials are sold, bartered, or given away. You shall not either directly or through the use of any device, software, internet site, web-based service, or other means remove, alter, bypass, avoid, interfere with, or circumvent any copyright, trademark, or other proprietary notices marked on the Content or any digital rights management mechanism, device, or other content protection or access control measure associated with the Content including geo-filtering mechanisms. Without prior written authorization from ISM, you shall not build a business utilizing the Content, whether or not for profit.

You shall not create, recreate, distribute, incorporate in other work, or advertise an index of any portion of the Content unless you receive prior written authorization from ISM. Requests for permission to reproduce or distribute ISM ROB Content can be made by contacting in writing at: ISM Research, Institute for Supply Management, 309 W. Elliot Road, Suite 113, Tempe, AZ 85284-1556, or by emailing kcahill@ismworld.org; subject: Content Request.

ISM shall not have any liability, duty, or obligation for or relating to the ISM ROB Content or other information contained herein, any errors, inaccuracies, omissions or delays in providing any ISM ROB Content, or for any actions taken in reliance thereon. In no event shall ISM be liable for any special, incidental, or consequential damages, arising out of the use of the ISM ROB. Report On Business®, Manufacturing PMI®, Services PMI®, and Hospital PMI™ are registered trademarks of Institute for Supply Management®. Institute for Supply Management® and ISM® are registered trademarks of Institute for Supply Management, Inc.

About Institute for Supply Management®
Institute for Supply Management® (ISM®) serves supply management professionals in more than 90 countries. Its 50,000 members around the world manage about US$1 trillion in corporate and government supply chain procurement annually. Founded in 1915 as the first supply management institute in the world, ISM is committed to advancing the practice of supply management to drive value and competitive advantage for its members, contributing to a prosperous and sustainable world. ISM leads the profession through the ISM Report On Business®, its highly regarded certification programs and the ISM Mastery Model®. This report has been issued by the association since 1931, except for a four-year interruption during World War II.

The full text version of the Services ISM® Report On Business® is posted on ISM®‘s website at www.ismrob.org on the third business day* of every month after 10:00 a.m. ET.

The next Services ISM® Report On Business® featuring March 2021 data will be released at 10:00 a.m. ET on Monday, April 5, 2021.

*Unless the New York Stock Exchange is closed.

Contact: 

Kristina Cahill

Report On Business® Analyst

ISM®, ROB/Research Manager

Tempe, Arizona

+1 480.455.5910

Email: kcahill@ismworld.org


Cision View original content to download multimedia:http://www.prnewswire.com/news-releases/services-pmi-at-55-3-february-2021-services-ism-report-on-business-301239078.html

SOURCE Institute for Supply Management

Keystone Power Holdings Moves to Expand into Virginia, Maryland and Maine

PAOLI, Pa., March 3, 2021 /PRNewswire/ — Today, Keystone Power Holdings, LLC (Keystone), a renewable energy developer/owner of solar facilities, announced its intention to expand into Virginia, Maryland and <span…

PAOLI, Pa., March 3, 2021 /PRNewswire/ — Today, Keystone Power Holdings, LLC (Keystone), a renewable energy developer/owner of solar facilities, announced its intention to expand into Virginia, Maryland and Maine. It recently opened an office in Richmond, Virginia. Keystone has already completed medium to large photovoltaic solar projects in the Carolinas, Illinois, Massachusetts, New York, and New Jersey. Keystone’s customers range from municipalities and non-profits to schools and universities (private and public) to large public corporations.

«We are excited to be moving into new markets to offer solar energy to more clients while growing the company,» said William DePhillipo, co-founder of Keystone Power Holdings. «The company is well-positioned to take advantage of the favorable shifts in state policy in Virginia, Maryland and Maine. We continue to deepen our expertise in developing solar projects and look forward to building partnerships in these states.»

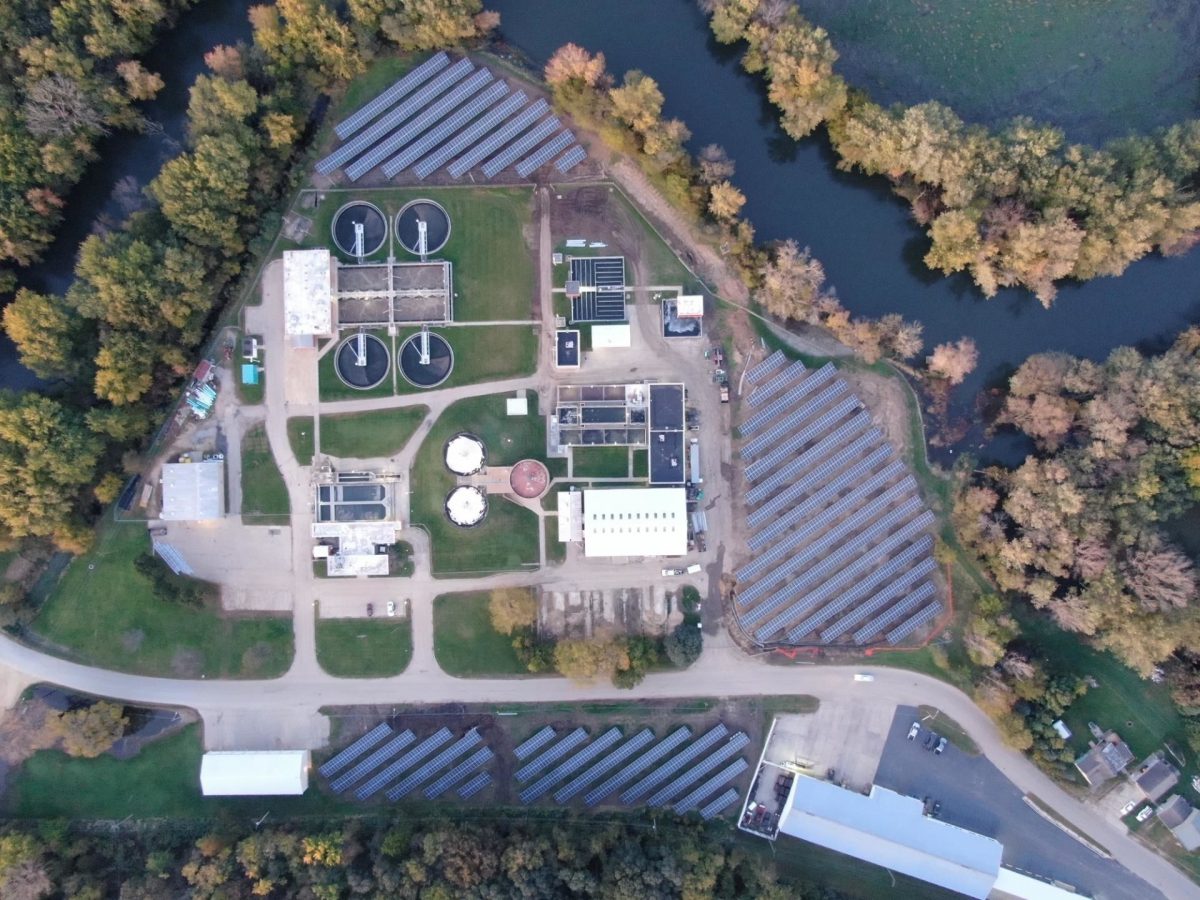
The company’s municipal/non-profit segment has been successful with a focus on wastewater treatment plants. Solid credit, high electricity usage and ease of installation make these types of solar installations attractive for all parties. As an example, Keystone worked with the City of Freeport, Illinois to bring solar energy to its sewage treatment plant. The system, 1.165 MW DC in size, is installed onsite and connected to the plant. The project has been financed through a long-term power purchase agreement (PPA) with Keystone. Estimated savings are significant – projected to be just under a million dollars over the term of the agreement.  

Keystone is one of the leading solar companies for treatment plant providers. It has many of these projects already in operation, an additional two awaiting permission to operate and a further project signed for construction later this year. This growth demonstrates Keystone’s leadership within the municipal/non-profit segment, and will allow it to serve its new customers well in Virginia, Maryland and Maine. 

«Municipal water and wastewater treatment plants are great clients for us. With electricity many times taking 40% or more of a plant’s operating budget, solar energy offers them an opportunity to reduce costs and have a positive environmental impact,» said Anthony Fotopoulos, co-founder of Keystone Power Holdings. «At the same time, it builds resiliency into the power grid and helps defend critical infrastructure against climate impact. We see this triple benefit (savings/environment/infrastructure) across our diverse customer base.»

The company remains positioned to finance a broader range of projects than many others in the solar industry. Its investment fund, KPH Solar Farms Fund I, continues to provide repeatable financing for eligible solar energy projects (250 kilowatts to 10 megawatts), removing the burden of up-front investment for its clients. Established in 2017, the fund provides 100 percent of the initial debt, equity/tax equity and construction financing for Keystone’s projects, making resources available at a time when consistent funding is a challenge.

About Keystone Power Holdings
Keystone Power Holdings, LLC is a renewable energy developer and owner of solar energy facilities. We specialize in developing medium to large-scale photovoltaic solar systems across North America. We develop facilities for municipalities and non-profits, public and private universities and schools, and large corporate clients on or near their properties, either on the ground or rooftop, while passing on savings. For more information, email info@keystoneph.com or visit our website at www.keystoneph.com.

Media Contact:

Laura L. Kieley
Signal Hill Communications
lkieley@signalhillcomms.com
551.482.5732


Cision View original content to download multimedia:http://www.prnewswire.com/news-releases/keystone-power-holdings-moves-to-expand-into-virginia-maryland-and-maine-301239727.html

SOURCE Keystone Power Holdings

GAF Energy Announces Key Leadership Promotions

SAN FRANCISCO, March 3, 2021 /PRNewswire/ — GAF Energy, a leading provider of roof-integrated solar solutions in North America, has announced three key promotions on its…

SAN FRANCISCO, March 3, 2021 /PRNewswire/ — GAF Energy, a leading provider of roof-integrated solar solutions in North America, has announced three key promotions on its leadership team. The company has promoted David Kaltsas, Jason Barrett, and Reynolds Holmes as part of its ongoing expansion and strategic positioning for continued growth in 2021. Earlier this year, the company announced an additional hire to its leadership team, rounding out its manufacturing and development division.

«We believe that the future of residential solar is in BIPV. These promotions are intended to strategically position our team to meet the growing demand for solar roofing in America,» said Martin Debono, President of GAF Energy. «David, Jason, and Reynolds have all demonstrated the leadership qualities that support our vision to generate power from every roof. I’m thrilled to continue working alongside our entire leadership team to bring our industry-leading solar roof product to the masses in 2021 and beyond.»

David Kaltsas, Senior Vice President, Operations
David Kaltsas has an extensive background in the solar industry with specific expertise in the commercial and industrial space, serving as COO of Sol-Wind and President and COO of SunWize. He previously was Executive Director, Renewable Energy, Operations & Investment at GAF, GAF Energy’s sister company and the largest roofing company in North America. David has extensive portfolio management expertise in the rapidly growing C&I solar market. He holds a BA in Global Change and Transformational Leadership from the University of St. Thomas.

Jason Barrett, Senior Vice President, Sales
Jason Barrett joined GAF in 2015 as VP of Renewable Energy, Structured Finance, and Investments (a team incorporated into GAF Energy in 2019). Prior to GAF, Jason served as Chief Commercial Officer of Sol-Wind and a founding partner of Paladin Strategic Partners. He has held senior positions at Merrill Lynch, Credit Suisse, Fannie Mae, and Morgan Stanley. He has a BBA in Finance and International Business from Howard University and an MBA from Cornell University, where he was a Robert Toigo Fellow.

Reynolds Holmes, Vice President, Services & Product Management
Prior to joining GAF Energy, Reynolds’ held senior leadership positions at both SolarCity and Tesla, where he led launches of new energy products, services, and experiences designed for scale. He earned a BS in Electrical Engineering from Yale University and is currently pursuing an MBA at the University of Oregon.

GAF Energy empowers roofing contractors across the U.S. with a comprehensive and economical approach to solar installations. The GAF Energy solar system couples innovative, attractive, and affordable solar technology with fast, easy installation.

Designed to provide a good-looking, low-profile alternative to rack-mounted solar panels — which are typically drilled through the roof’s shingles — GAF Energy solar integrates directly with the roofing system and is part of the primary water-shedding layer. The company recently announced new super high-efficiency solar panels to optimize a customer’s power output and maximize aesthetic appeal.

About GAF Energy
GAF Energy is transforming the rooftop solar industry to generate «Energy from every roof™». As a Standard Industries company, GAF Energy works in partnership with North America’s largest roofing and waterproofing manufacturer, GAF, offering homeowners elegant, roof-integrated solar options. The company also facilitates commercial tax equity financing for large-scale rooftop solar projects. For more information, visit www.gaf.energy.


Cision View original content:http://www.prnewswire.com/news-releases/gaf-energy-announces-key-leadership-promotions-301239723.html

SOURCE GAF Energy

Enel’s First Large-Scale Wind + Storage Hybrid Project Will Support Kellogg Company With Renewable Energy

ROME and BOSTON, March 3, 2021 /PRNewswire/ — Enel, through its US renewable subsidiary Enel Green Power North America, has started construction of Azure Sky wind + storage, its…

ROME and BOSTON, March 3, 2021 /PRNewswire/ — Enel, through its US renewable subsidiary Enel Green Power North America, has started construction of Azure Sky wind + storage, its first large-scale hybrid project globally to integrate wind and battery storage at one site. Through a 100 MW virtual power purchase agreement (VPPA), Enel will sell to Kellogg Company a 360 GWh portion of the electricity delivered to the grid annually from the Azure Sky wind project, which is equal to 50% of the volume of electricity used across Kellogg’s North American manufacturing facilities. Located in Throckmorton County, Texas, the 350 MW wind farm paired with approximately 137 MW of battery storage will be Enel’s third hybrid project in the U.S. that integrates a renewable energy plant with utility-scale battery storage.

«As our first large-scale project to pair wind and storage, and our largest hybrid plant globally, Azure demonstrates Enel’s continued commitment to leading the energy transition towards a 100% renewable powered electric grid,» said Salvatore Bernabei, CEO of Enel Green Power and Head of Enel’s Global Power Generation business line. «This transition is supported and accelerated by commercial customers, like Kellogg Company, who are placing sustainability at the core of their business.»

Under the terms of the VPPA, Kellogg will purchase approximately 360 GWh of electricity annually from Enel, contributing to the leading plant-based food company’s collective efforts to achieve over 50% renewable energy and reach 50% of its global Better Days goal to reduce its Scope 1 and 2 greenhouse gas emissions by 65%. Kellogg’s renewable electricity purchase is the equivalent amount of electricity it takes power more than 43,000 homes each year in North America and is estimated to avoid over 250,000 metric tons of CO2 emissions annually, equivalent to the amount of carbon sequestered by 330,000 acres of US forest each year, which is larger than Rocky Mountain National Park.2

«Kellogg has been working to reduce its carbon footprint across our value chain for more than a decade,» said Amy Senter, Kellogg Company Chief Sustainability Officer. «This latest VPPA further demonstrates to investors, stakeholders and our consumers that we are taking swift action to address climate change.»

The 79 wind turbines at the Azure Sky project are expected to generate over 1,300 GWh each year, which will be delivered to the grid and will charge the battery located in the same facility. The expected annual electricity generated by the Azure Sky project is equivalent to avoiding the emission of over 842,000 tons of CO2 into the atmosphere each year. The battery storage system will be capable of storing the power generated by the wind turbines, while also providing services to enhance grid flexibility. At around 137 MW, the system will be one of the largest battery storage facilities in the world.

The Azure Sky wind + storage project is the latest example of Enel’s commitment to invest in renewables-plus-storage hybrids in the US. Enel is currently constructing a similar plant, the 284 MW3 Azure Sky solar + storage project, in a neighboring county and a third hybrid project, 181 MW4 Lily solar + storage project also in Texas.

The Enel Group is closely following the status of the COVID-19 pandemic and is responding, as a main priority, to protect the health of its workers, employees and the community where it operates. In North America, the company has enacted strict travel guidelines, stepped up office and project site sanitation and implemented ways for colleagues to conduct their work remotely and follow safe working practices if and when on-site. At the Azure Sky construction site, crews are implementing safe working practices and operations have been structured to maintain social distancing as well as other best practices. Furthermore, as part of its 1.3 million US dollar commitment in response to the COVID-19 pandemic across the US and Canada, the company developed initiatives to support community hospitals, schools and emergency responders in Texas.

Enel Green Power North America is a leading developer, long-term owner and operator of renewable energy plants in North America, with a presence in 15 US states and one Canadian province. The company operates 60 plants with a managed capacity of over 6.7 GW powered by renewable wind, geothermal and solar energy. https://www.enelgreenpower.com/countries/north-america/united-states

Enel is a multinational power company and a leading integrated player in the global power, gas, and renewables markets. It is the largest European utility by ordinary EBITDA, and is present in over 30 countries worldwide, producing energy with around 88 GW of installed capacity. Enel distributes electricity through a network of over 2.2 million kilometers, and with more than 74 million business and household end users globally, the Group has the largest global customer base among its European peers. Enel’s renewables arm Enel Green Power is the world’s largest renewable private player, with around 49 GW of wind, solar, geothermal, and hydropower plants installed in Europe, the Americas, Africa, Asia, and Oceania.

Media Relations
T +39 06 8305 5699
ufficiostampa@enel.com

1 137 MWdc, which will inject up to 120 MWac peak power into the grid

2 Emissions equivalencies calculated by using The U.S. EPA Greenhouse Gas Equivalencies Calculator, based on national averages. https://www.epa.gov/energy/greenhouse-gas-equivalencies-calculator

3 284 MWdc, which will inject up to 225 MWac peak power in to the grid

4 181 MWdc solar panels will inject up to 146 MWac peak power in to the grid


Cision View original content to download multimedia:http://www.prnewswire.com/news-releases/enels-first-large-scale-wind–storage-hybrid-project-will-support-kellogg-company-with-renewable-energy-301239609.html

SOURCE Enel Green Power North America

Commercial Vehicle Group Announces Groundbreaking Partnership with Xos, Inc.

NEW ALBANY, Ohio, March 3, 2021 /PRNewswire/ — Commercial Vehicle Group (NASDAQ: CVGI), a global leader in the creation in electric systems, has announced a partnership with leading state-of-the-art commercial electric vehicle manufacturer Xos, Inc. to develop sustainability initiatives that champion innovation and best-in-class solutions for growing macro-trends in the marketplace.

…

NEW ALBANY, Ohio, March 3, 2021 /PRNewswire/ — Commercial Vehicle Group (NASDAQ: CVGI), a global leader in the creation in electric systems, has announced a partnership with leading state-of-the-art commercial electric vehicle manufacturer Xos, Inc. to develop sustainability initiatives that champion innovation and best-in-class solutions for growing macro-trends in the marketplace.

Commercial Vehicle Group Announces Groundbreaking Partnership with Xos, Inc.

This collaboration represents CVG’s commitment to offer unparalleled products and services to customers in the commercial trucking industry. Beginning in 2020, CVG started executing an entrepreneurial plan to diversify its offerings to compete in an evolving market reflecting trends in e-commerce, last-mile delivery, and electric vehicle innovation.

CVG’s partnership offers Xos, Inc. full-service design and manufacturing including product sampling, prototypes, schematic electric system design, testing, and validation to support a cutting-edge fleet of medium- to heavy-duty, zero-emissions, electric vehicles.

«We are very happy to be partnering with Xos, Inc. to design and launch leading technology with the X-Platform 1 within the electric vehicle industry. The electric vehicle industry is exploding with new platforms across many vehicle types, and with CVG’s storied expertise, we see our many strengths and natural advantages as a prime benefit to our partnership. With over 40 years of experience in helping vehicle makers launch outstanding vehicles quickly, CVG provides assistance from concept, to prototype, showing our commitment to our diverse customer base,» said CVG President and CEO, Harold Bevis.    

«We’re thrilled to partner with such a long-standing, experienced leader in the commercial vehicle space,» said Xos, Inc. co-founder and COO Giordano Sordoni. «CVG has been innovating for more than two decades, so we look forward to supporting them as they increase their focus on electrification and continue leading the path of innovation within the commercial vehicle space for years to come.»

CVG operates in 30 global locations. The company’s continued innovation and engineering expertise allow for CVG to adapt strategically and invest in new markets. The partnership with Xos, Inc. and correlating initiatives reflect the company’s ability to innovate with agility in growing markets while maintaining consistency and dependability across the industry.

About CVG
CVG (through its subsidiaries) is a diversified industrial company and leading supplier of seating systems, warehouse automation subsystems, wire harnesses, plastic parts, and mechanical assemblies for many markets including the following: trucking, construction, retail, military, bus, agricultural, and off-road recreational markets. Information about the Company and its products is available on the internet at www.cvgrp.com.

About Xos, Inc.
Xos, Inc. is an electric mobility company dedicated to making fleets more efficient. Xos designs and develops fully electric battery mobility systems specifically for commercial fleets. The company’s primary focus is on medium- and heavy-duty commercial vehicles that travel on last-mile routes, i.e. predictable routes that are less than 200 miles per day. The company leverages its proprietary technologies to provide commercial fleets with zero-emission vehicles that are easier to maintain and more cost-efficient on a total cost of ownership (TCO) basis than their internal combustion engine and commercial EV counterparts. For more information, please visit www.xostrucks.com. 

Forward-Looking Statements

This press release contains forward-looking statements about CVG that are subject to risks and uncertainties. These statements often include words such as «believe», «anticipate», «plan», «expect», «intend», «will», «should», «could», «would», «project», «continue», «likely», and similar expressions. In particular, this press release may contain forward-looking statements about CVG’s expectations for future periods with respect to its plans to improve financial results, the future of CVG’s end markets, including the short-term and long-term impact of the COVID-19 pandemic on our business, changes in the Class 8 and Class 5-7 North America truck build rates, performance of the global construction equipment business, CVG’s prospects in the wire harness, warehouse automation and electric vehicle markets, CVG’s initiatives to address customer needs, organic growth, CVG’s strategic plans and plans to focus on certain segments, completion faced by CVG, volatility in and disruption to the global economic environment and CVG’s financial position or other financial information. These statements are based on certain assumptions that CVG has made in light of its experience as well as its perspective on historical trends, current conditions, expected future developments and other factors it believes are appropriate under the circumstances. Actual results may differ materially from the anticipated results because of certain risks and uncertainties, including those included herein and in CVG’s filings with the SEC. There can be no assurance that statements made in this press release relating to future events will be achieved. CVG undertakes no obligation to update or revise forward-looking statements to reflect changed assumptions, the occurrence of unanticipated events or changes to future operating results over time. All subsequent written and oral forward-looking statements attributable to CVG or persons acting on behalf of CVG are expressly qualified in their entirety by such cautionary statements.

MEDIA CONTACTS

Micah Paldino
Micah@makepbj.com
513.668.7676

Stuart Lindle
Stuart@makepbj.com
513.482.9541


Cision View original content to download multimedia:http://www.prnewswire.com/news-releases/commercial-vehicle-group-announces-groundbreaking-partnership-with-xos-inc-301239710.html

SOURCE Commercial Vehicle Group, Inc.

Women of Worth de L’Oréal Paris lanza convocatoria para nominar heroínas cotidianas

NUEVA YORK, 3 de marzo de 2021 /PRNewswire-HISPANIC PR WIRE/ — L’Oréal Paris, la marca de cosmética número uno en el mundo, busca heroínas cotidianas de nuestra sociedad al…

NUEVA YORK, 3 de marzo de 2021 /PRNewswire-HISPANIC PR WIRE/ — L’Oréal Paris, la marca de cosmética número uno en el mundo, busca heroínas cotidianas de nuestra sociedad al anunciar la convocatoria a nominaciones para la versión 2021 de sus premios Women of Worth. Desde ahora y hasta el 30 de abril, se invita a los consumidores a nominar en LOrealParis.com a una mujer que realice aportes generosos a su comunidad a través de un liderazgo sin fines de lucro, por la oportunidad de ser designada como una de las diez homenajeadas y recibir hasta $45,000 para su causa.

Women of Worth de L’Oréal Paris presentó su nueva campaña el domingo 28 de febrero pasado en plena temporada de premios, invitando a los estadounidenses de todo el país a presentar sus nominaciones para las homenajeadas de este año. Con la voz de Viola Davis e imágenes de Noelle Lambert, la homenajeada nacional del año pasado, y de otras participantes de ediciones anteriores, la nueva campaña publicitaria destacó momentos extraordinarios de los últimos 16 años de Women of Worth.

En 2021, el programa filantrópico continúa dándole vida al famoso eslogan de la marca «Porque tú lo vales», apoyando a mujeres cuya resistencia, valentía y coraje inquebrantables demuestran el poder de reconocer el propio valor. Las homenajeadas de este año se unirán a la red multifacética de 150 becarias del programa, quienes apoyan una amplia gama de causas que ejemplifican la aceptación del valor propio y la transmisión de dicha valía a otras personas.

«Mientras en 2021 celebramos los 50 años de nuestro famoso eslogan ‘Porque tú lo vales’, damos la bienvenida a historias que no solo reflejan el poder de las Women of Worth precedentes, sino también a personas que demuestran el valor intrínseco y la importancia de las mujeres en todo el mundo», sostuvo Ali Goldstein, presidenta de L’Oréal Paris en los Estados Unidos. «En este año emblemático, estamos orgullosos de destacar a las próximas diez mujeres que encuentran belleza en la solidaridad, y no podemos esperar para conocerlas».

Para encontrar a sus diez homenajeadas, una vez más L’Oréal Paris unirá sus fuerzas con Points of Light, la mayor organización mundial dedicada al servicio voluntario. Además de recibir apoyo financiero para su organización, Women of Worth le dará a cada homenajeada una plataforma nacional para dar a conocer su historia y la oportunidad de desarrollar una red que amplifique su causa para que tenga un impacto aún mayor en las vidas de los demás.

«Es un privilegio colaborar con L’Oréal Paris para reconocer a las homenajeadas Women of Worth de este año y destacar a quienes buscan impulsar el cambio en sus comunidades y hacer del mundo un lugar mejor», manifestó Natalye Paquin, presidenta y directora ejecutiva de Points of Light. «En 2021, Women of Worth se involucró en innumerables vidas a través del importante trabajo filantrópico que desarrollan, y creemos que representan lo mejor de la humanidad».

El año pasado Women of Worth lanzó su primer especial de televisión a nivel nacional, donde reunió a una importante lista de embajadoras de L’Oréal Paris para destacar la misión especial de cada una de las homenajeadas.

En 2021, L’Oréal Paris duplicará sus subvenciones individuales a $20,000 para generar un impacto aún mayor. Una homenajeada nacional, elegida por el voto popular, recibirá $25,000 adicionales por su trabajo solidario. Cada una de las participantes del Women of Worth de 2021 será reconocida como un gran ejemplo de cómo la solidaridad realmente puede cambiar el mundo.

Para más información sobre Women of Worth, nominar a una mujer audaz que esté marcando la diferencia en el mundo o saber más sobre las anteriores homenajeadas, visite LOrealParis.com.

Para más información sobre los programas, campañas y eventos innovadores de Points of Light, visite www.pointsoflight.org.

Acerca de L’Oréal Paris
La división L’Oréal USA, Inc. de  L’Oréal Paris es una marca de cuidados para la belleza integral, dedicada a empoderar a mujeres ofreciendo productos exclusivos e innovadores disponibles en el mercado masivo.  El famoso eslogan de la marca, «Porque tú lo vales», nació en los Estados Unidos en 1973 para celebrar la belleza y la valía intrínseca de la mujer. L’Oréal Paris provee sus productos a mujeres de todo el mundo en cuatro categorías principales de belleza: coloración del cabello, cuidado del cabello, cuidado de la piel y cosméticos. Con la invención de la coloración para el cabello por parte de L’Oréal en 1909, la empresa continúa siendo líder de innovación en productos capilares de color, cuidado y estilismo con marcas como Superior Preference, Féria, Colorista, Elvive, Ever Collection y Elnett Satin Hairspray. L’Oréal Paris ofrece productos de cuidado para la piel desarrollados científicamente y probados para tratar los problemas particulares de cada piel a través de sus reconocidas marcas Revitalift, Pure-Sugar, Pure-Clay, Age Perfect y Sublime Bronze. Los famosos cosméticos de L’Oréal Paris incluyen el éxito de ventas Voluminous Lash Paradise y también las colecciones Infallible, True Match, Colour Riche, Voluminous y Visible Lift. Para más información sobre L’Oréal Paris y para recibir atención personalizada, consejos de expertos y contenido exclusivo, visite www.lorealparisusa.com o siga a la marca en Instagram (@LOrealParis), Twitter (@LOrealParisUSA), Facebook (@LOrealParisUSA) y Pinterest (@LOrealParisUSA).

Sobre Points of Light
Points of Light es una organización mundial sin fines de lucro que inspira, capacita y moviliza a millones de personas para que emprendan acciones que cambien el mundo. Imaginamos un mundo en el que cada persona descubra el poder que posee para marcar una diferencia, creando comunidades saludables en sociedades dinámicas y productivas. A través de afiliados en 200 ciudades de 37 países, y en asociación con miles de organizaciones sin fines de lucro y corporaciones, Points of Light involucra a cinco millones de voluntarios con 14 millones de horas de servicio cada año. Llevamos el poder de las personas a donde más se necesita. Para obtener más información, visite www.pointsoflight.org.

Contacto de prensa:
Golin
Salina Benítez
sbenitez@golin.com

Logotipo: https://mma.prnewswire.com/media/1447913/L_Oreal_Paris_Women_of_Worth.jpg

FUENTE L’Oréal Paris

HEAT X™ Successfully Completes UL Field Evaluation for Its Technology Applications in Appliances

AUBURN HILLS, Mich., March 3, 2021 /PRNewswire/ — HEAT X™, one of the technology leaders and largest patent holders of magnetocaloric and magnetic induction heating technologies, today announced that it has successfully completed Underwriters Laboratories (UL) Field Evaluations on its 5kW and 2.5kW Air Magnetocaloric/Magnetic Induction Heater Assemblies, as well as its 1.5kW Magnetocaloric/Magnetic Induction Cooktop Assembly.

The field evaluation process, conducted by one of the world’s most…

AUBURN HILLS, Mich., March 3, 2021 /PRNewswire/ — HEAT X™, one of the technology leaders and largest patent holders of magnetocaloric and magnetic induction heating technologies, today announced that it has successfully completed Underwriters Laboratories (UL) Field Evaluations on its 5kW and 2.5kW Air Magnetocaloric/Magnetic Induction Heater Assemblies, as well as its 1.5kW Magnetocaloric/Magnetic Induction Cooktop Assembly.

The field evaluation process, conducted by one of the world’s most respected certification companies, included the construction inspection for use of its components, assemblies and limited nondestructive testing to complete the assessment.

«This UL Field Evaluation is a testament of the value that our talented team in HEAT X has generated. Our technology will allow our global commercial partners to benefit from our technologies to lead, in a sustainable way, any heating market,» said Christopher Meso, one of the founding Investors of HEAT X. «Our team has designed an exemplary line of Magnetocaloric/Magnetic appliances, and we’re pleased to be able to offer these technologies to world-wide commercialization partners, who will be able to very quickly integrate our technologies into their products and manufacturing processes.

HEAT X™’s innovative magnetocaloric/magnetic induction patented designs use a refined combination of cost competitive and abundant materials. HEAT X™ has accomplished its goal of delivering more efficient, emission-free heating technologies using less components and lower material costs compared to existing fuel-based technologies. HEAT X™ is planning full scale commercialization in Q3 2021.

For further information about HEAT X™, visit www.heatxtech.com

About HEAT X

HEAT X™ is a technology development and licensing company established in June of 2018 and is headquartered in Auburn Hills, Mich., USA. HEAT X relentlessly focuses on improving people’s lives, reducing the use of energy and delivering the next generation of clean technologies in magnetocaloric/magnetic induction heating for air, surfaces and fluids. Our innovative approach to these technologies enables us also to empower our partners to become leaders in solving climate challenges. The result is the development of unique technologies for residential, commercial, industrial and transportation sectors that creates value for customers, users and a positive impact in our environment and the world at large.


Cision View original content:http://www.prnewswire.com/news-releases/heat-x-successfully-completes-ul-field-evaluation-for-its-technology-applications-in-appliances-301238566.html

SOURCE HEAT X

Kellogg Company to Achieve Over 50% Renewable Electricity Globally by the End of 2022

BATTLE CREEK, Mich., March 3, 2021 /PRNewswire/ — Kellogg announced today that the company will achieve over 50% renewable energy to address the electricity needs of its owned manufacturing globally by the end of 2022. The company signed a long-term wind energy virtual power purchase agreement (VPPA) in North America with Enel Green Power for approximately 360 gigawatt hours (GWh) of wind electricity annually, which is equal to 50% of…

BATTLE CREEK, Mich., March 3, 2021 /PRNewswire/ — Kellogg announced today that the company will achieve over 50% renewable energy to address the electricity needs of its owned manufacturing globally by the end of 2022. The company signed a long-term wind energy virtual power purchase agreement (VPPA) in North America with Enel Green Power for approximately 360 gigawatt hours (GWh) of wind electricity annually, which is equal to 50% of the volume of electricity used across Kellogg’s North American manufacturing facilities.

Kellogg’s VPPA portion of the renewable energy generated by the wind farm is equivalent to the amount of electricity it takes to power more than 43,000 homes each year.1 

This VPPA progresses Kellogg towards its global Better Days commitments to reduce Scope 1 & 2 greenhouse gas emissions by 65% and to achieve 100% renewable electricity by 2050. Kellogg announced the milestone to investors at the Consumer Analyst Group of New York (CAGNY) conference, underpinning the company’s commitment to address corporate responsibility. Kellogg measures greenhouse gas emissions and renewable electricity in accordance with the GHG Protocol.

«Kellogg has been working to reduce its carbon footprint across our value chain for more than a decade,» said Amy Senter, Chief Sustainability Officer, Kellogg Company. «Our latest VPPA further demonstrates to investors, stakeholders and our consumers that we are taking action to address climate change.»

Kellogg has several renewable energy projects already in place around the world.

  • Kellogg’s facilities across Western Europe have achieved 100% renewable electricity to address its operations through the purchase of Renewable Energy Certificates (RECs).
  • Kellogg Australia operations also achieved 100% renewable electricity through a long-term Power Purchase Agreement.
  • Kellogg’s LEED® certified Pringles plant in Enstek, Malaysia and its cereal plant in Taloja, India utilize renewable electricity directly from on-site solar panels.
  • In North America, Kellogg has purchased Renewable Energy Certificates (RECs) for multiple facilities and offices in several states.
  • The company’s Kashi office in Solana Beach, California utilizes on-site solar panels for portions of its electricity use.

With the support of Kellogg’s VPPA, Enel has started construction of Azure Sky wind in north central Texas, its first wind + storage project globally, that combines a 350 MW wind facility paired with approximately 120 MW of battery storage – one of the largest battery storage facilities in the world. The Azure Sky wind farm will add clean energy resources to the community’s local grid and is expected to be operational in 2022.

Kellogg’s portion of renewable electricity generated by the wind farm is estimated to avoid 250,000 metric tons of CO2 emissions each year, equivalent to the carbon reduction of removing approximately 55,000 passenger vehicles off of the road annually.2  Kellogg was advised on the VPPA agreement by Schneider Electric Energy & Sustainability Services, who assisted the company in its project selection and negotiations. 

«As our first project to pair wind and storage, and our largest hybrid plant globally, Azure demonstrates Enel’s continued commitment to leading the energy transition towards a 100% renewable powered electric grid,» said Salvatore Bernabei, CEO of Enel Green Power. «This transition is supported and accelerated by customers, like Kellogg Company, who are placing sustainability at the core of their business.»

As the demand for sustainable investing continues to grow, investors more than ever want to know that companies are actively addressing (ESG) issues. S&P Global recently ranked Kellogg’s sustainability performance within the top 15% of the food industry, making Kellogg among the highest performing sustainable companies in the world.

To learn more about Kellogg’s sustainability efforts, visit KelloggCompany.com.

About Kellogg Company
At Kellogg Company (NYSE: K), our vision is a good and just world where people are not just fed but fulfilled. We are creating better days and a place at the table for everyone through our trusted food brands. Our beloved brands include Pringles®, Cheez-It®, Special K®, Kellogg’s Frosted Flakes®, Pop-Tarts®, Kellogg’s Corn Flakes®, Rice Krispies®, Eggo®, Mini-Wheats®, Kashi®, RXBAR®, MorningStar Farms® and more. Net sales in 2020 were approximately $13.8 billion, comprised principally of snacks and convenience foods like cereal, frozen foods, and noodles. As part of our Kellogg’s® Better Days purpose platform, we’re helping to end hunger and are committed to creating Better Days for 3 billion people by the end of 2030. Visit www.KelloggCompany.com or www.OpenforBreakfast.com.

Forward-Looking Statements
This news release contains «forward-looking statements» about sustainability performance and projects. These statements are made on the basis of the Company’s views and assumptions at this time and the Company undertakes no obligation to update these statements unless required by law. This statement is not a guarantee of future performance; and actual events or results may differ materially from this statement. Investors should consult the Company’s filings with the Securities and Exchange Commission (including the information set forth under the caption «Risk Factors» in the Company’s Annual Report on Form 10-K for the fiscal year ended December 28, 2019 and the Company’s Quarterly Report on Form 10-Q for the quarter ended September 26, 2020) for information about certain factors that could cause such differences. Copies of these filings may be obtained upon request from the Company’s Investor Relations department or on the Company’s web site at http://www.kelloggcompany.com.

1 Source: Emissions equivalencies calculated by using The U.S. EPA Greenhouse Gas Equivalencies Calculator, based on national averages. https://www.epa.gov/energy/greenhouse-gas-equivalencies-calculator

2 Source: Emissions equivalencies calculated by using The U.S. EPA Greenhouse Gas Equivalencies Calculator, based on national averages. https://www.epa.gov/energy/greenhouse-gas-equivalencies-calculator

Cision View original content to download multimedia:http://www.prnewswire.com/news-releases/kellogg-company-to-achieve-over-50-renewable-electricity-globally-by-the-end-of-2022-301239171.html

SOURCE Kellogg Company

FUNKIER reports a significant increase by high percentage in Sportswear sales during the epidemic period

TRAVERSE CITY, Mich., March 3, 2021 /PRNewswire/ — The COVID-19 crisis that hit the world in early 2020 forced the entire world industries to shut down, but had a positive effect on the bicycle industry.

In the absence of motorized transportation – the world has moved to riding two-wheelers, electrical or mechanical, which have had resulting in shortage of bicycles and parts worldwide.

The clothing and equipment manufacturers have had a great increase in revenue rate during the crisis…

TRAVERSE CITY, Mich., March 3, 2021 /PRNewswire/ — The COVID-19 crisis that hit the world in early 2020 forced the entire world industries to shut down, but had a positive effect on the bicycle industry.

In the absence of motorized transportation – the world has moved to riding two-wheelers, electrical or mechanical, which have had resulting in shortage of bicycles and parts worldwide.

The clothing and equipment manufacturers have had a great increase in revenue rate during the crisis of COVID-19. «The new situation is really unusual,» explains Roni Katsav, owner of Funkier, the large clothing and equipment company. «When COVID-19 arrived, we did not work for two months and thought the world is coming to an end. Suddenly we saw that the bicycle industry was experiencing a big boom and the demand for cycling clothes went skyrocketing. Since we have returned to work, we have been busy working hard to catch up for the high demand at the apparel market.»

The increase in demand was not only recorded in the international market in which FUNKIER operates, such as the USA, UK, Spain and Thailand. Surprisingly, these are not only customers who cultivate their sporting hobby, but also those who had been commuting to work with their bikes.

«During the quarantine, we had lots of free time, therefore a lot of new riders have joined the cycling family which increases sales mainly from the Internet,» says Katsav.

The gyms were forced to close which made the cycling sport more popular in the general population that saw them buying bicycles for exercising and transportation. The United States saw a sharp increase in demand for bicycles that generates about $ 800 million a year in cycling clothing.

These days, it is launching a sales campaign for winter clothes and is offering a riding jacket for men starting at $ 16 and a bib for women starting at $ 19.

About
FUNKIER is the large bicycle clothing and equipment company. It was founded about 20 years ago as a fashion company and over the years was transformed into a sports apparel company. FUNKIER started marketing its products through bicycle and travel stores and other countries around the world such as the United States, United Kingdom, Spain, India, Thailand, and Russia.

For more information, please contact Yaniv Levy, Director of Marketing Communications by email: yaniv@funkierbike.com


Cision View original content:http://www.prnewswire.com/news-releases/funkier-reports-a-significant-increase-by-high-percentage-in-sportswear-sales-during-the-epidemic-period-301239561.html

SOURCE FUNKIER

Motili Carbon Reduction Champions Realize $240 Million in Energy Savings in 2020

DENVER, March 3, 2021 /PRNewswire-PRWeb/ — Motili, a leading property and HVAC technology company, today announced that five of its customers, in multifamily, commercial real estate and single family property management, achieved $240 million dollars in total energy savings over the 10-year warranty of…

DENVER, March 3, 2021 /PRNewswire-PRWeb/ — Motili, a leading property and HVAC technology company, today announced that five of its customers, in multifamily, commercial real estate and single family property management, achieved $240 million dollars in total energy savings over the 10-year warranty of their systems in 2020. These Carbon Reduction Champions also accomplished carbon savings of over 183,000 air conditioning units – a savings of over 2 million gallons of gas.

Motili began awarding its customers an annual prize at the end of 2019, to show appreciation for these customers’ efforts to improve energy efficiency and have a positive impact on the environment. In 2019, Motili’s Carbon Reduction Champions reduced 62,716 KgCo2e worth of emissions. In 2020 that record was shattered by an astounding 16,643,914 KgCo2e reduction in emissions.

HVAC is the largest energy consumer of commercial and multi-family buildings. Through their sustainability efforts, in 2020, despite its hardships, Motili’s Carbon Reduction Champions improved the quality of their properties, created energy savings for their residents, improved operating income with reduced operational expense and lowered their carbon emissions.

In all, Motili’s Carbon Reduction Champions collectively reduced their energy savings per resident unit, per year by 19% – about $76 dollars of energy savings per building resident. These Carbon Reduction Champions replaced tens of thousands of HVAC systems nationwide, improving resident comfort, lowering energy bills, and lowering carbon emissions through these operational improvements.

«It was a year like no other, yet Motili’s Carbon Reduction Champions made massive strides in carbon savings over the course of 2020,» said Matthew Sallee, Vice President of Multi-Family, Motili. «We are incredibly pleased with their willingness to replace under performing systems. Their contribution to energy savings is a model for other multi-family and commercial building owners to follow. We’re looking forward to 2021to see what energy savings can be attained over the course of this year.»

Motili is transforming property management systems by combining people, process and technology into a unique nationally supported, locally provided solution. Motili has achieved ground-breaking HVAC efficiency and performance with its unique approach, delivering new levels of savings, simplicity and strategic insights for a growing roster of well-known residential and commercial property customers. Motili’s predictive analytics improves budgeting accuracy by predicting project equipment lifecycle, heading off reactive repair jobs before they happen.

# # #

About Motili
Motili’s technology platform allows property managers, owners and investors to easily manage repair and replacement jobs. Motili handles all aspects of the job from scheduling to ordering equipment to invoicing, making Motili the single point of contact for all property maintenance and equipment replacement.
Visit: http://www.motili.com to learn more.

Media Contact

Joanne Hogue, Smart Connections PR for Motili, (410) 658-8246, joanne@smartconnectionspr.com


SOURCE Motili